 Time-dependent CP violation & Unitarity Triangle angles
|
Time-dependent CP violation & Unitarity Triangle angles
|
Click here for a list of measurements (including updates) which have been released since the cut-off for inclusion in this set of averages
| § Studies of b → cc-bar s Transitions |
| § Studies of Colour Suppressed b → cu-bar d Transitions |
| § Studies of b → cc-bar d Transitions |
| § Studies of b → qq-bar s (penguin) Transitions |
| § Studies of b → qq-bar d (penguin) Transitions |
| § Studies of b → sγ Transitions |
| § Studies of b → dγ Transitions |
| § Studies of b → uu-bar d Transitions |
| § Studies of Time-Dependent Interference Between b → cu-bar d and b-bar → u-bar cd-bar Transitions |
| § Studies of Interference Between b → cu-bar s & b → uc-bar s Transitions |
Legend: if not stated otherwise,
We use Combos v3.20 (homepage, manual) for the rescaling of the experimental results to common sets of input parameters.
The experimental results have been rescaled to a common set of input parameters (see table below).
| Parameter | Value | Reference |
|---|---|---|
| τ(Bd) | (1.527 ± 0.008) ps | HFAG - Oscillations/Lifetime |
| Δmd | (0.508 ± 0.004) ps−1 | HFAG - Oscillations/Lifetime |
|
|A⊥|2 (CP-odd fraction in B0→ J/ψK* CP sample) |
0.233 ± 0.010 ± 0.005 |
BaBar: PRD 76 (2007) 031102
N(BB)=232m |
| 0.195 ± 0.012 ± 0.008 |
Belle: PRL 95 (2005) 091601
N(BB)=275m |
|
| 0.219 ± 0.009 |
Average
χ2 = 4.3/1 dof (CL=0.04 ⇒ 2.1σ) |
Additional note on commonly treated (correlated) systematic effects:
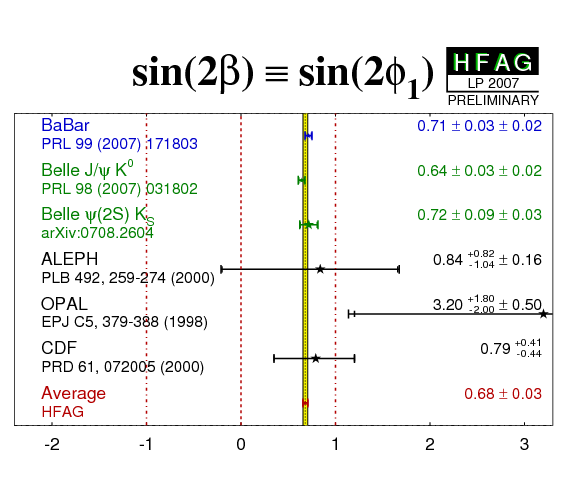
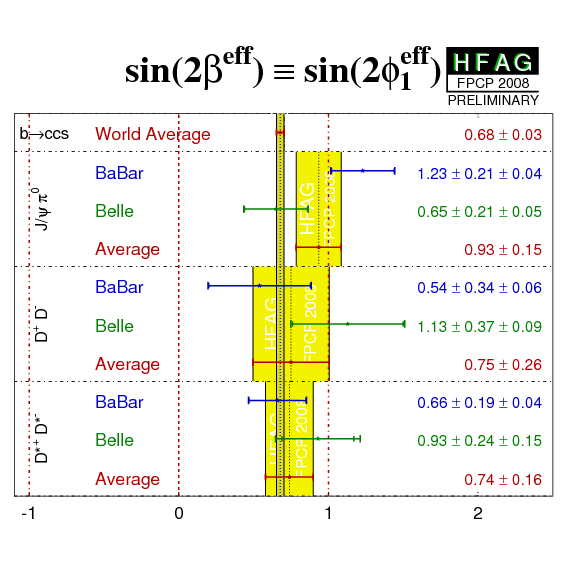
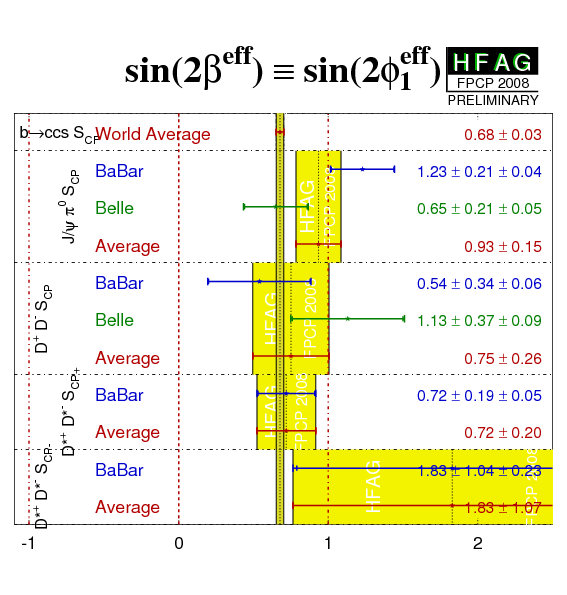
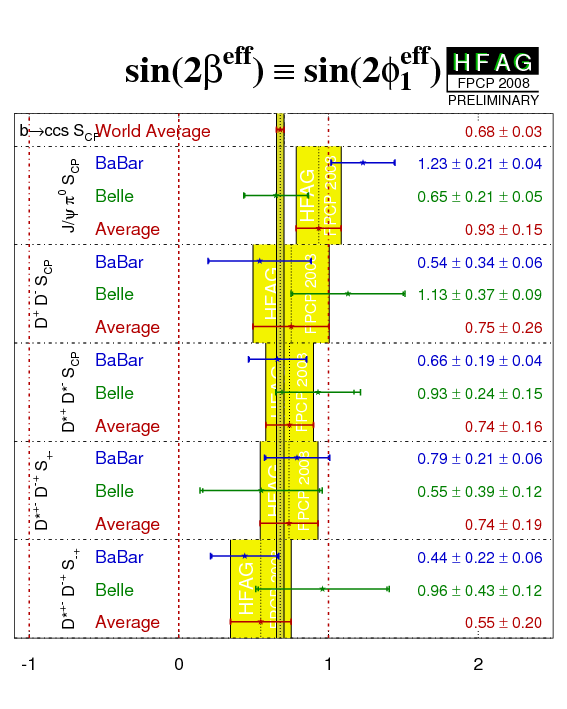
We obtain for sin(2β) ≡ sin(2φ1) in the different decay modes:
| Parameter: sin(2β) ≡ sin(2φ1) | ||||
|---|---|---|---|---|
| Mode | BaBar | Belle | Average | Reference |
| Charmonium: | N(BB)=384M | N(BB)=535M | - |
BaBar (PRL 99 (2007) 171803)
Belle (PRL 98 (2007) 031802) |
| J/ψKS (ηCP=-1) | 0.686 ± 0.039 ± 0.015 | 0.643 ± 0.038stat | ||
| J/ψKL (ηCP=+1) | 0.735 ± 0.074 ± 0.067 | 0.641 ± 0.057stat | ||
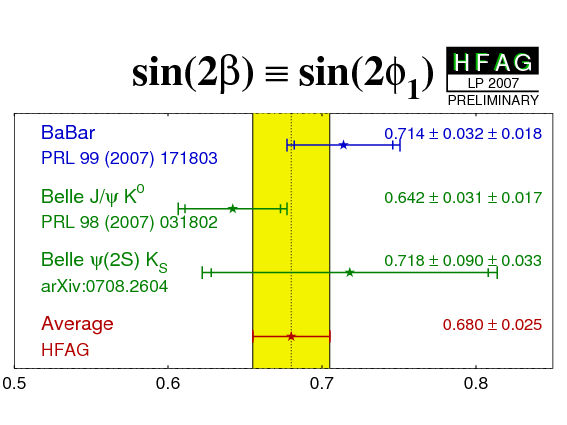
| J/ψK0 | 0.697 ± 0.035 ± 0.016 | 0.642 ± 0.031 ± 0.017 |
0.668 ± 0.026
(0.023stat-only) |
CL = 0.29 |
| ψ(2S)KS (ηCP=-1) | 0.947 ± 0.112 ± 0.062 | 0.718 ± 0.090 ± 0.033
N(BB)=657M |
0.802 ± 0.077
(0.070stat-only) |
BaBar (PRL 99 (2007) 171803)
Belle (arXiv:0708.2604) |
| χc1KS (ηCP=-1) | 0.759 ± 0.170 ± 0.037 | - | - | BaBar (PRL 99 (2007) 171803) |
| ηcKS (ηCP=-1) | 0.778 ± 0.195 ± 0.093 | - | ||
| J/ψK*0 (K*0 → KSπ0) (ηCP= 1-2|A⊥|2) | 0.477 ± 0.271 ± 0.155 | - | ||
| All charmonium | 0.714 ± 0.032 ± 0.018 | 0.650 ± 0.029 ± 0.018 |
0.680 ± 0.025
(0.022stat-only) |
CL = 0.33 |
Including earlier sin(2β) ≡ sin(2φ1) measurements using Bd → J/ψKS decays:
| Parameter: sin(2β) ≡ sin(2φ1) | ||||
|---|---|---|---|---|
| Experiment | Value | Reference | ||
| ALEPH | 0.84 +0.82−1.04 ± 0.16 | PL B492 (2000) 259-274 | ||
| OPAL | 3.2 +1.8−2.0 ± 0.5 | EPJ C5 (1998) 379-388 | ||
| CDF (full Run I) | 0.79 +0.41−0.44(stat+syst) | PRD 61 (2000) 072005 | ||
we find the only slightly modified average:
| Parameter: sin(2β) ≡ sin(2φ1) | ||||
|---|---|---|---|---|
| All charmonium | 0.681 ± 0.025 (0.022stat-only) | CL = 0.48 | ||
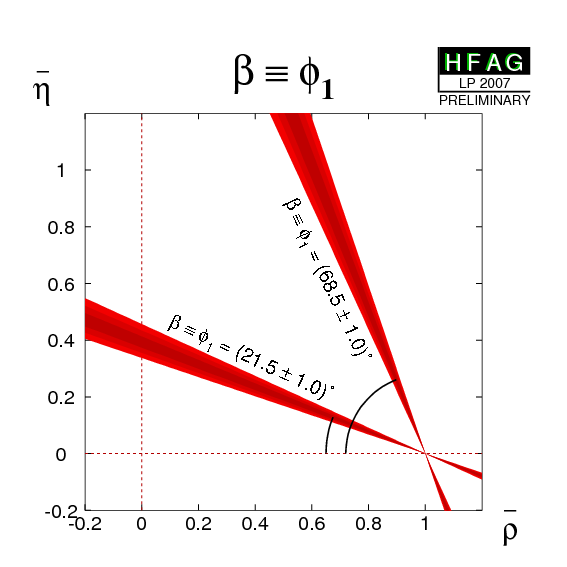
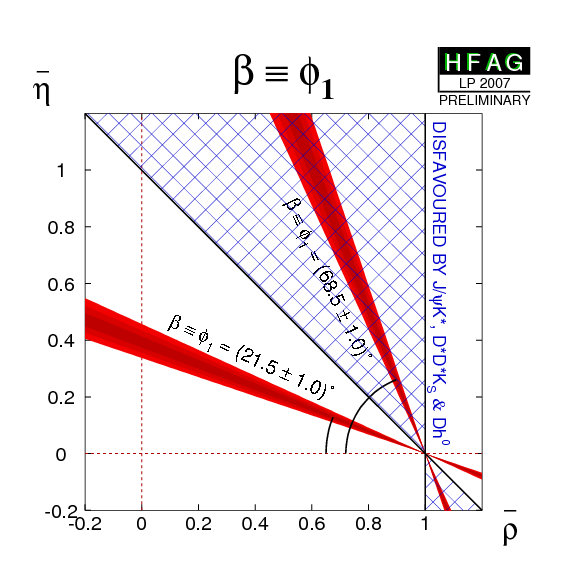
from which we obtain the following solutions for β ≡ φ1 (in [0, π])
| β ≡ φ1 = (21.5 ± 1.0)° | or | β ≡ φ1 = (68.5 ± 1.0)° |
Plots:
| Average of sin(2β) ≡ sin(2φ1) from all experiments. |
eps.gz png |
|||
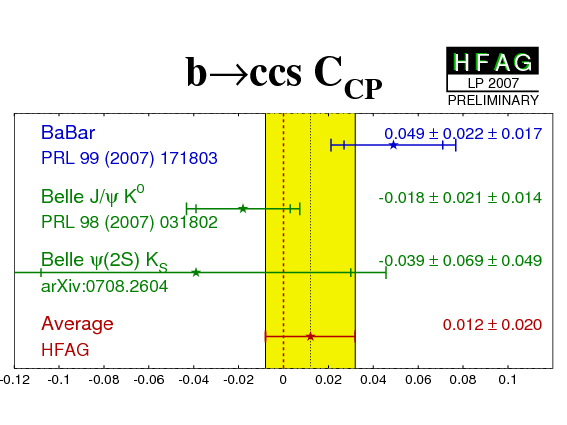
| Averages of sin(2β) ≡ sin(2φ1) and C=-A from the B factories. |
eps.gz png |
eps.gz png |
||
| Constraint on the ρ-bar-η-bar plane: |
eps.gz png |
eps.gz png |
||
|
Constraining the Unitarity Triangle (ρ, η):
Visit the CKMfitter and UTfit sites for results on global CKM fits using different fit techniques and input quantities. |
Historically the experiments determined |λ| for the charmonium modes; more recently the parameters C = −A = (1−|λ|2)/(1+|λ|2) are being used, as they are in all other time-dependent CP analyses. We recompute C from |λ| (from the BaBar results) for the following averages.
| Parameter: C=−A (if not stated otherwise) | ||||
|---|---|---|---|---|
| Mode | BaBar | Belle | Average | Reference |
| Charmonium | N(BB)=384M | N(BB)=535M | - |
BaBar (PRL 99 (2007) 171803)
Belle (PRL 98 (2007) 031802) |
| J/ψKS | 0.051 ± 0.027 ± 0.015 | 0.001 ± 0.028stat | ||
| J/ψKL | −0.063 ± 0.062 ± 0.030 | −0.045 ± 0.033stat | ||
| J/ψK0 | 0.035 ± 0.025 ± 0.018 | −0.018 ± 0.021 ± 0.014 |
0.002 ± 0.021
(0.016stat-only) |
CL = 0.15 |
| ψ(2S)KS | 0.142 ± 0.079 ± 0.047 | −0.039 ± 0.069 ± 0.049
N(BB)=657M |
0.032 ± 0.068
(0.055stat-only) |
BaBar (PRL 99 (2007) 171803)
Belle (arXiv:0708.2604) |
| χc1KS | 0.339 ± 0.102 ± 0.104 | - | - | BaBar (PRL 99 (2007) 171803) |
| ηcKS | 0.053 ± 0.141 ± 0.037 | - | ||
| J/ψK*0 (K*0 → KSπ0) | 0.047 ± 0.083 ± 0.026 | - | ||
| All charmonium | 0.049 ± 0.022 ± 0.017 | −0.019 ± 0.025 (0.020stat-only) |
0.012 ± 0.020
(0.015stat-only) |
CL = 0.10 |
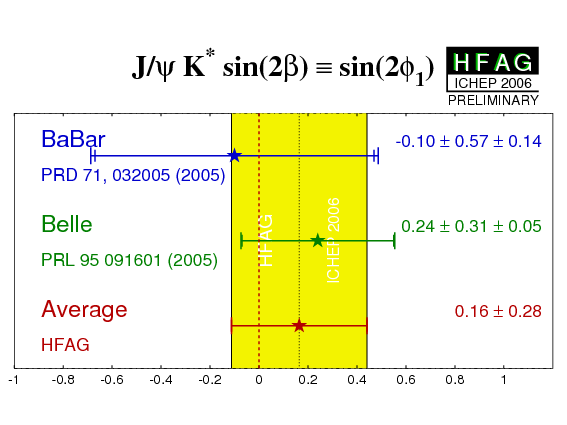
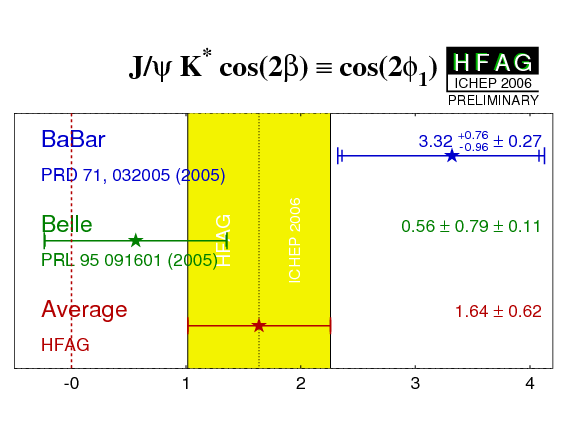
The BaBar and Belle collaborations have performed measurements of sin(2β) & cos(2β) ≡ sin(2φ1) & cos(2φ1) in time-dependent transversity analyses of the pseudoscalar to vector-vector decay B0→ J/ψK*, where cos(2β) ≡ cos(2φ1) enters as a factor in the interference between CP-even and CP-odd amplitudes. In principle, this analysis comes along with an ambiguity on the sign of cos(2β) ≡ cos(2φ1) due to an incomplete determination of the strong phases occurring in the three transversity amplitudes. BaBar resolves this ambiguity by inserting the known variation of the rapidly moving P-wave phase relative to the slowly moving S-wave phase with the invariant mass of the Kπ system in the vicinity of the K*(892) resonance. The result is in agreement with the prediction obtained from s-quark helicity conservation. It corresponds to Solution II defined by Suzuki, which is the phase convention used for the averages given here.
At present we do not apply a rescaling of the results to a common, updated set of input parameters.
| Experiment | sin(2β) ≡ sin(2φ1)J/ψK* | cos(2β) ≡ cos(2φ1)J/ψK* | Correlation | Reference |
|---|---|---|---|---|
|
BaBar
N(BB)=88M |
−0.10 ± 0.57 ± 0.14 | 3.32 +0.76 −0.96 ± 0.27 | −0.37 (stat) | PRD 71, 032005 (2005) |
|
Belle
N(BB)=275M |
0.24 ± 0.31 ± 0.05 |
0.56 ± 0.79 ± 0.11
[using Solution II] |
0.22 (stat) | PRL 95 091601 (2005) |
| Average |
0.16 ± 0.28
χ2 = 0.3/1 dof (CL = 0.61 → 0.5σ) |
1.64 ± 0.62
χ2 = 4.7/1 dof (CL = 0.03 → 2.2σ) |
uncorrelated averages |
HFAG
See remark below table |
|
|
eps.gz png |
eps.gz png |
. | |
BaBar
find a confidence level for cos(2β)>0 of 89%.
Note that due to the strong non-Gaussian character of the BaBar measurement,
the interpretation of the average given above
has to be done with the greatest care.
We perform uncorrelated averages
(using the PDG prescription
for asymmetric errors).
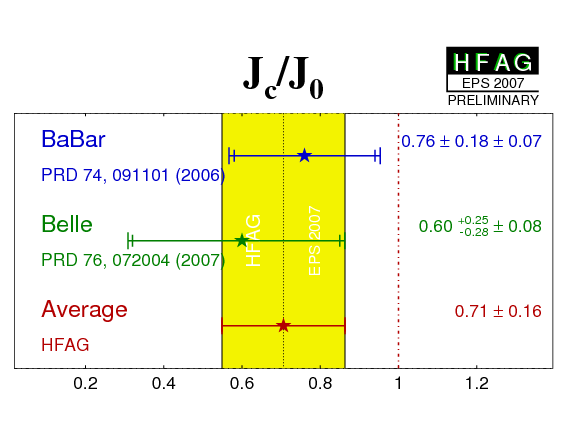
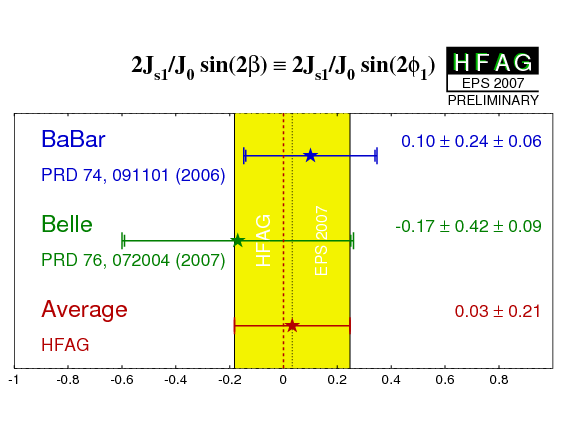
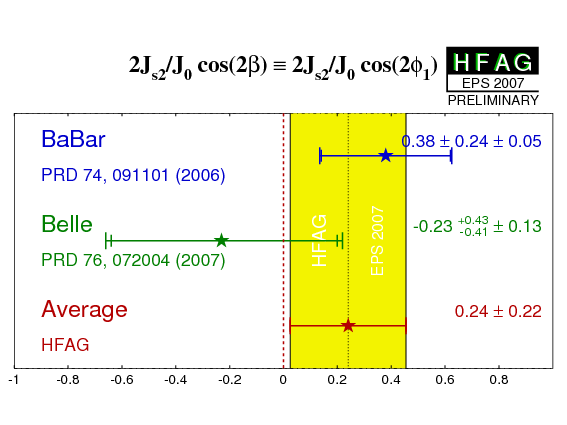
The decays Bd → D(*)D(*)KS are dominated by the b → cc-bar s transition, and are therefore sensitive to 2β ≡ 2φ1. However, since the final state is not a CP eigenstate, extraction of the weak phases is difficult. Browder et al. have shown that terms sensitive to cos(2β) ≡ cos(2φ1) can be extracted from the analysis of Bd → D*D*KS decays (with some theoretical input).
Analysis of the Bd → D*D*KS decay has been performed by BaBar. and Belle.
The analyses proceed by dividing the Dalitz plot into two: m(D*+KS)2 > m(D*−KS)2 (ηy = +1) and m(D*+KS)2 < m(D*−KS)2 (ηy = -1). They then fit using a PDF where the time-dependent asymmetry (defined in the usual way as the difference between the time-dependent distributions of B0-tagged and B0-bar-tagged events, divided by their sum) is given by
| A(Δt) = ηy (Jc/J0) cos(ΔmdΔt) − [ (2Js1/J0)sin(2β) + ηy (2Js2/J0)cos(2β) ] sin(ΔmdΔt) |
The parameters J0, Jc, Js1 and Js2 are the integrals over the half-Dalitz plane m(D*+KS)2 < m(D*−KS)2 of the functions |a|2 + |a-bar|2, |a|2 - |a-bar|2, Re(a-bar a*) and Im(a-bar a*) respectively, where a and a-bar are the decay amplitudes of B0 → D*D*KS and B0-bar → D*D*KS respectively. The parameter Js2 (and hence Js2/J0) is predicted to be positive.
At present we do not apply a rescaling of the results to a common, updated set of input parameters.
| Experiment | Jc/J0 | (2Js1/J0)sin(2β) ≡ (2Js1/J0)sin(2φ1) | (2Js2/J0)cos(2β) ≡ (2Js2/J0)cos(2φ1) | Correlation | Reference |
|---|---|---|---|---|---|
|
BaBar
N(BB)=230M |
0.76 ± 0.18 ± 0.07 | 0.10 ± 0.24 ± 0.06 | 0.38 ± 0.24 ± 0.05 | - | PRD 74, 091101 (2006) |
|
Belle
N(BB)=449M |
0.60 +0.25 −0.28 ± 0.08 | −0.17 ± 0.42 ± 0.09 | −0.23 +0.43 −0.41 ± 0.13 | - | PRD 76, 072004 (2007) |
| Average |
0.71 ± 0.16
χ2 = 0.2 (CL=0.63 ⇒ 0.5σ) |
0.03 ± 0.21
χ2 = 0.3 (CL=0.59 ⇒ 0.5σ) |
0.24 ± 0.22
χ2 = 1.4 (CL=0.23 ⇒ 1.2σ) |
uncorrelated averages | HFAG |
|
|
eps.gz png |
eps.gz png |
eps.gz png |
. | |
From the above result and the assumption that Js2>0, BaBar infer that cos(2β)>0 at the 94% confidence level.
Decays of the Bs meson via the b → cc-bar s transition probe φs, a CP violating phase related to Bs–Bs-bar mixing. An important difference with respect to the Bd–Bd-bar system, is that the value of ΔΓ is predicted to significantly non-zero, allowing information on φs to be extracted without tagging the flavour of the decaying B meson. Within the Standard Model, φs is predicted to be very small, O(λ2).
The vector-vector final state J/ψ φ contains mixtures of polarization amplitudes: the CP-odd A⊥, and the CP-even A0 and A||. These terms need to be disentangled, using the angular distributions, in order to extract φs, and their interference provides additional sensitivity. The sensitivity to φs depends strongly on ΔΓ, and less strongly on the perpendicularly polarized fraction, |A⊥|2.
|
In this discussion we make the approximation φs ≈ −2βs where φs ≡ arg[ − M12 / Γ12 ] and 2βs ≡ 2 arg[ − VtsVtb* / VcsVcb* ]. This is a reasonable approximation since, although the equality does not hold in the Standard Model, both are much smaller than the current experimental resolution, whereas new physics contributions add a phase φNP to φs and subtract the same phase from 2βs, so that the approximation remains valid. |
Measurements of φs from Bs → J/ψ φ have been performed by CDF and D0.
CDF have carried out the first flavour-tagged, time-dependent analysis of Bs → J/ψ φ using 1.35 fb−1 of data. They do not present a central value and its uncertainty, due to the highly non-Gaussian shape of the likelihood function. Instead, they present a confidence region in the φs-ΔΓs plane, from which they obtain φs ∈ [−0.32, −2.82] at the 68% confidence level. The consistency with the Standard Model expectation for (φs,ΔΓs) is 15%. These results supercede results from an untagged analysis using 1.7 fb−1.
D0 have performed a flavour-tagged, time-dependent analysis of Bs → J/ψ φ using 2.8 fb−1 of data. They perform a fit in which the strong phase differences δ0 and δ|| (measured relative to δ⊥; and denoted δ2 and δ1 in their analysis) are constrained to the equivalent values measured in B0 → J/ψ K*0 (see HFAG b → c), up to an error of π/5, allowing for SU(3) breaking effects. The results are given in the table below. They also obtain a 90% CL allowed interval φs ∈ [−1.20, +0.06]. These results supercede results from an untagged analysis using 1 fb−1.
The implicit convention above is that |A⊥|2 + |A0|2 + |A|||2 = 1, and the strong phases are measured relative to that of the A⊥ component (which is set to zero). The polarization components are defined at time t=0, ie. at the production (primary) vertex of the Bs. Note also that there is, in principle, an ambiguity in the result for φs (a four-fold ambiguity in the case of untagged analysis). However, the D0 result employs an assumption on the strong phases, that breaks the ambiguity, and the confidence region quoted in the CDF result includes both solutions.
At present we do not apply a rescaling of the results to a common, updated set of input parameters.
| Experiment | τ(Bs) | ΔΓ | φs | A⊥ | |A0|2 - |A|||2 | Correlation | Reference |
|---|---|---|---|---|---|---|---|
| D0 | 1.52 ± 0.06 ± 0.01 | 0.19 ± 0.07 +0.02 −0.01 | −0.57 +0.24 −0.30 +0.07 −0.02 | 0.41 ± 0.04 +0.01 −0.02 | 0.34 ± 0.05 ± 0.03 | (stat) | arXiv:0802.2255 |
Bd decays to final states such as Dπ0 are governed by the b → cu-bar d transitions. If one chooses a final state which is a CP eigenstate, eg. DCPπ0, the usual time-dependence formulae are recovered, with the sine coefficient sensitive to sin(2β) ≡ sin(2φ1). Since there is no penguin contribution to these decays, there is even less associated theoretical uncertainty than for b → cc-bar s decays like Bd → J/ψ KS. See e.g. Fleischer, NPB 659, 321 (2003).
Results of such an analysis are available from BaBar. The decays Bd → Dπ0, Bd → Dη, Bd → Dω, Bd → D*π0 and Bd → D*η are used. The daughter decay D* → Dπ0 is used. The CP-even D decay to K+K− is used for all decay modes, with the CP-odd D decay to KSω also used in Bd → D(*)π0 and the additional CP-odd D decay to KSπ0 also used in Bd → Dω.
BaBar have performed separate fits for the cases where the intermediate D(*) decays to CP-even and CP-odd final states, since these receive different contributions fom subleading amplitudes in the Standard Model. Since the effects of these corrections are expected to be negligible (~0.02) compared to the current experimental uncertainty, they have also performed a fit with all decays combined.
| Mode | Experiment | −sin(2β) ≡ −sin(2φ1) | CCP | Correlation | Reference |
|---|---|---|---|---|---|
| D(*)CP+ h0 |
BaBar
N(BB)=383M |
−0.65 ± 0.26 ± 0.06 | −0.33 ± 0.19 ± 0.04 | 0.04 (stat) | PRL 99, 081801 (2007) |
| D(*)CP− h0 | −0.46 ± 0.46 ± 0.13 | −0.03 ± 0.28 ± 0.07 | −0.14 (stat) | ||
| D(*) h0 | −0.56 ± 0.23 ± 0.05 | −0.23 ± 0.16 ± 0.04 | −0.02 (stat) |
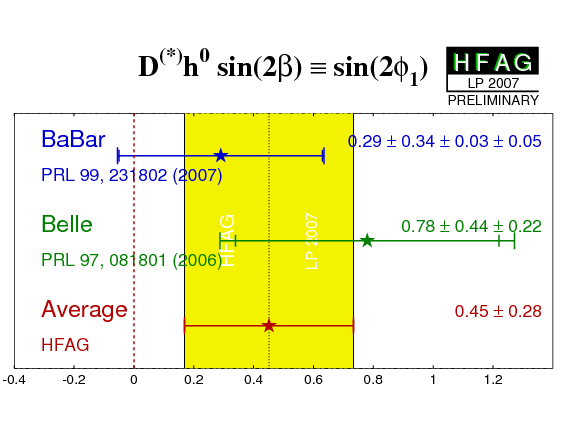
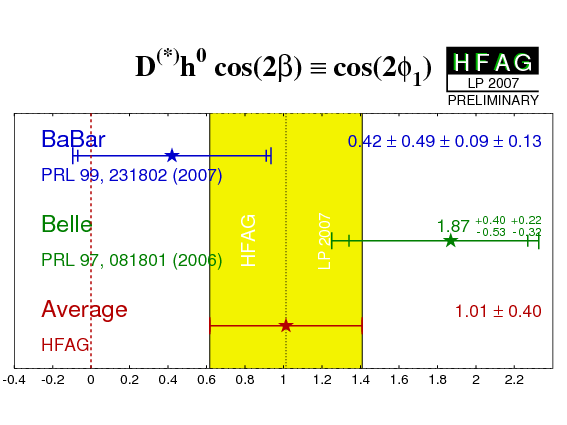
Bondar, Gershon and Krokovny have shown that when multibody D decays, such as D → KSπ+π− are used, a time-dependent analysis of the Dalitz plot of the D decay allows a direct determination of the weak phase: β ≡ φ1. Equivalently, both sin(2β) ≡ sin(2φ1) and cos(2β) ≡ cos(2φ1) can be measured. This information allows to resolve the ambiguity in the measurement of 2β ≡ 2φ1 from sin(2β) ≡ sin(2φ1) alone.
Results of such an analysis are available from both Belle and. BaBar. The decays Bd → Dπ0, Bd → Dη, Bd → Dω, Bd → D*π0 and Bd → D*η are used. The daughter decays are D* → Dπ0 and D → KSπ+π−. Note that BaBar quote uncertainties due to the D decay model separately from other systematic errors, while Belle do not.
At present we do not apply a rescaling of the results to a common, updated set of input parameters.
| Experiment | sin(2β) ≡ sin(2φ1) | cos(2β) ≡ cos(2φ1) | |λ| | Correlations | Reference |
|---|---|---|---|---|---|
|
BaBar
N(BB)=383M |
0.29 ± 0.34 ± 0.03 ± 0.05 | 0.42 ± 0.49 ± 0.09 ± 0.13 | 1.01 ± 0.08 ± 0.02 | (stat) | PRL 99, 231802 (2007) |
|
Belle
N(BB)=386M |
0.78 ± 0.44 ± 0.22 | 1.87 +0.40 −0.53 +0.22 −0.32 | - | - | PRL 97, 081801 (2006) |
| Average |
0.45 ± 0.28
χ2 = 0.7 (CL=0.41 ⇒ 0.8σ) |
1.01 ± 0.40
χ2 = 3.2 (CL=0.07 ⇒ 1.8σ) |
- | uncorrelated averages | HFAG |
|
|
eps.gz png |
eps.gz png |
. | ||
Interpretations:
Belle
determine the sign of cos(2φ)1 to be positive at 98.3% confidence level.
BaBar
favour the solution of β with cos(2β)>0 at 86% confidence level.
Note that the Belle measurement has strongly non-Gaussian behaviour.
The interpretation of the
average given above has to be done with the greatest care.
We perform uncorrelated averages
(using the PDG prescription
for asymmetric errors).
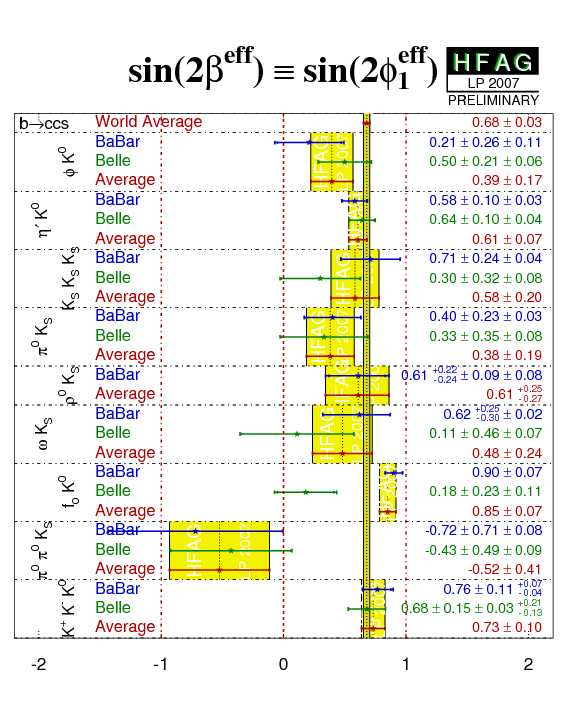
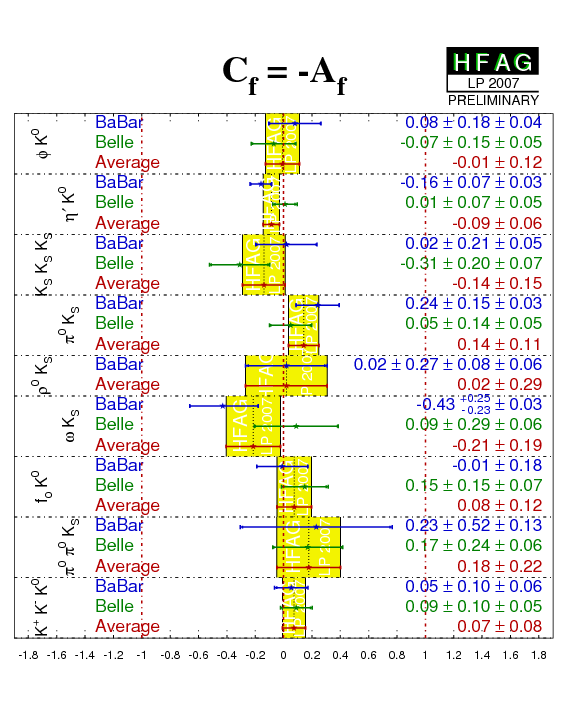
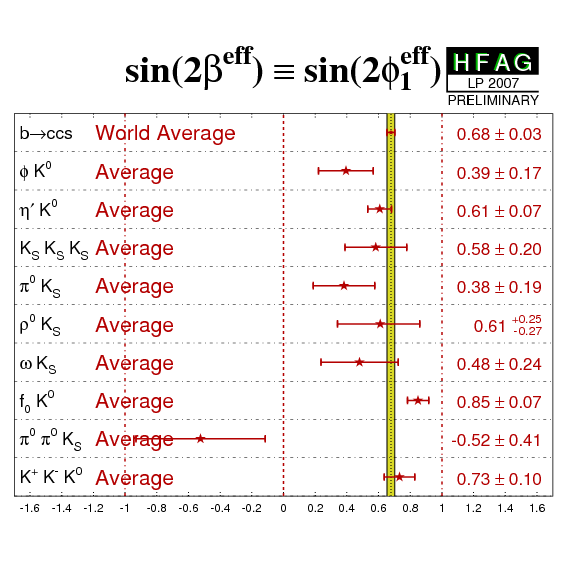
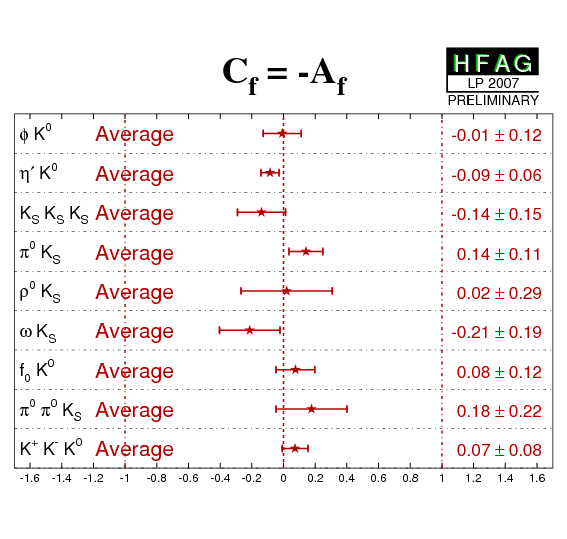
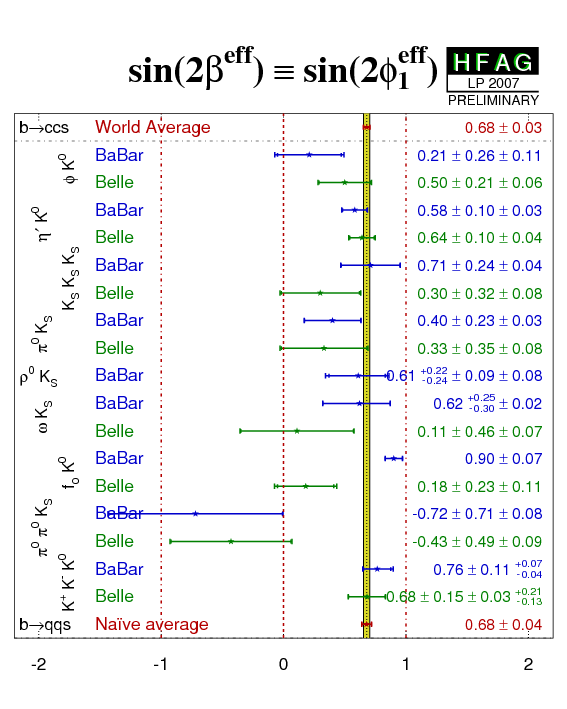
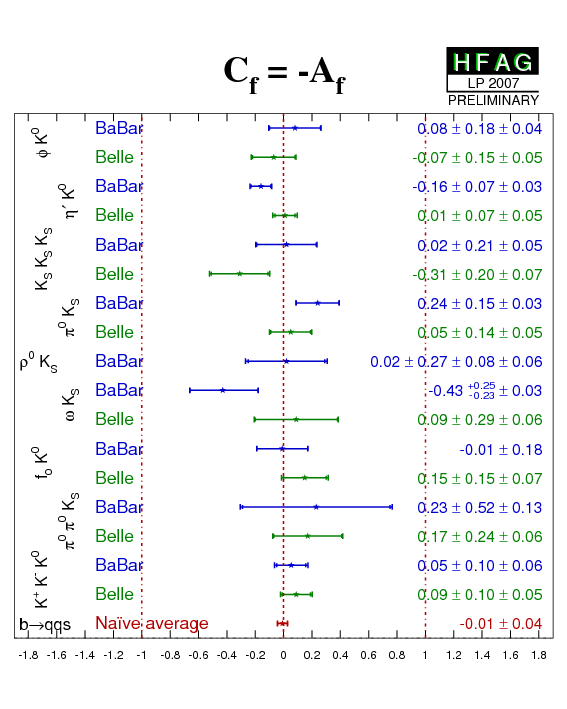
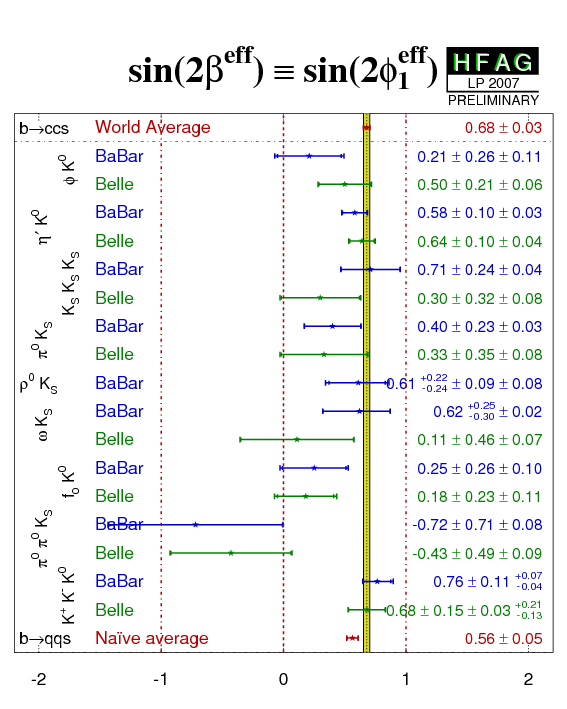
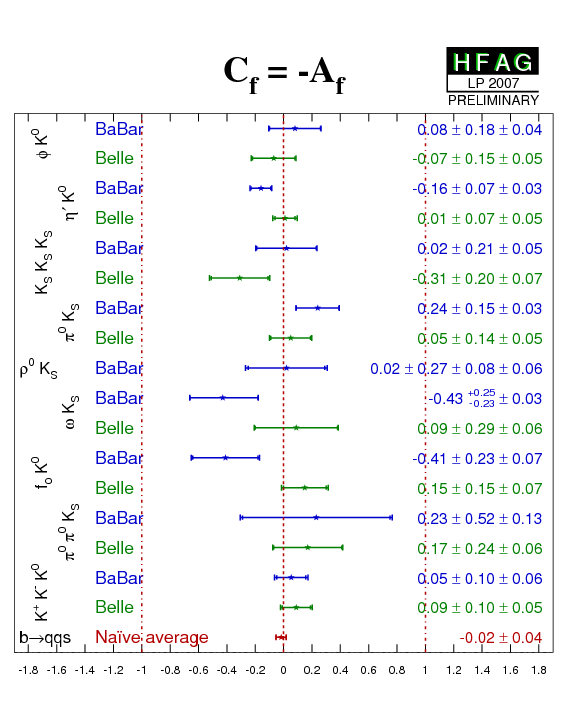
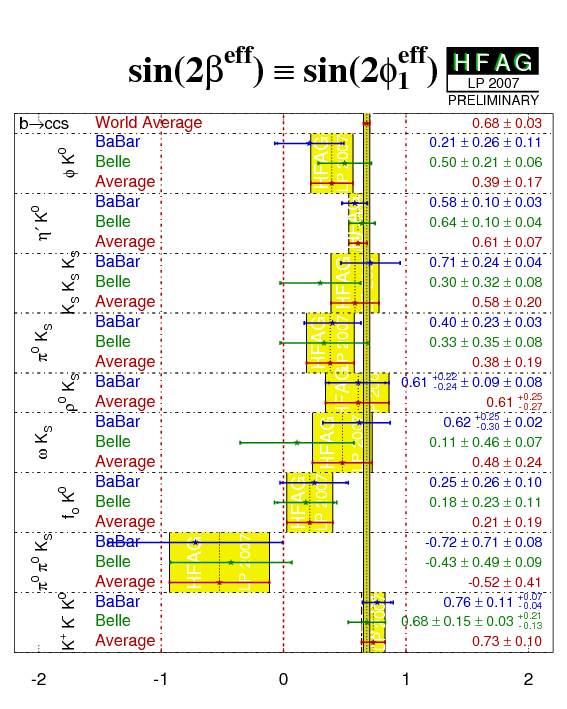
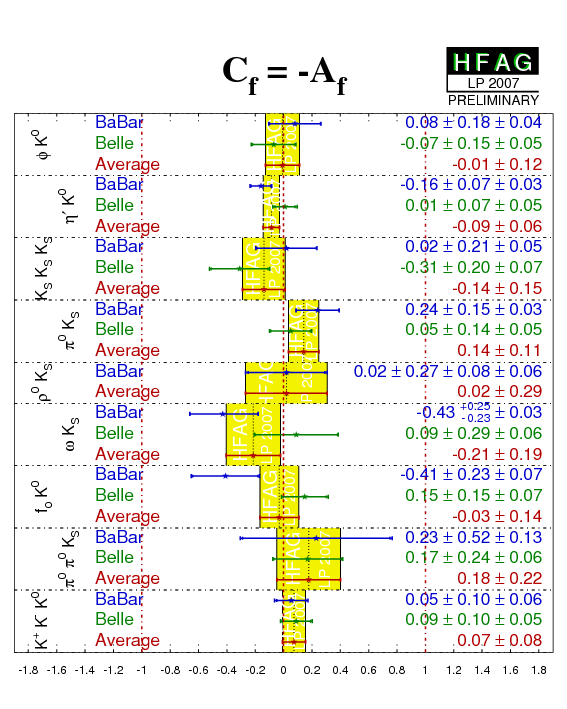
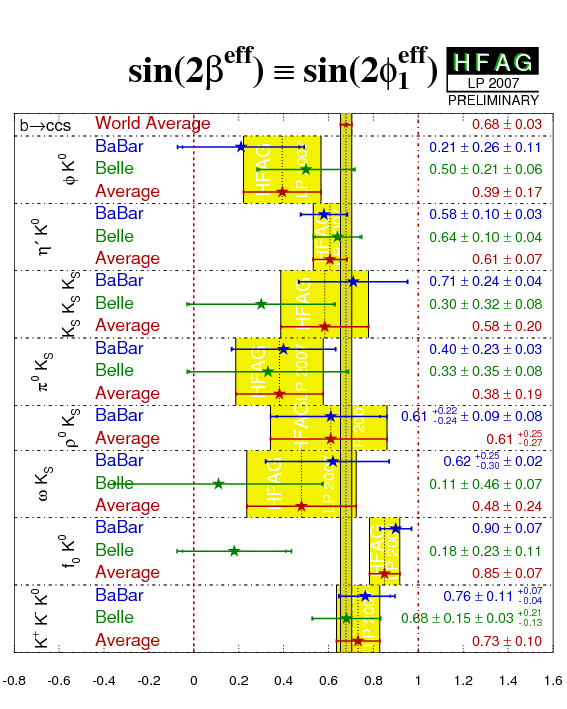
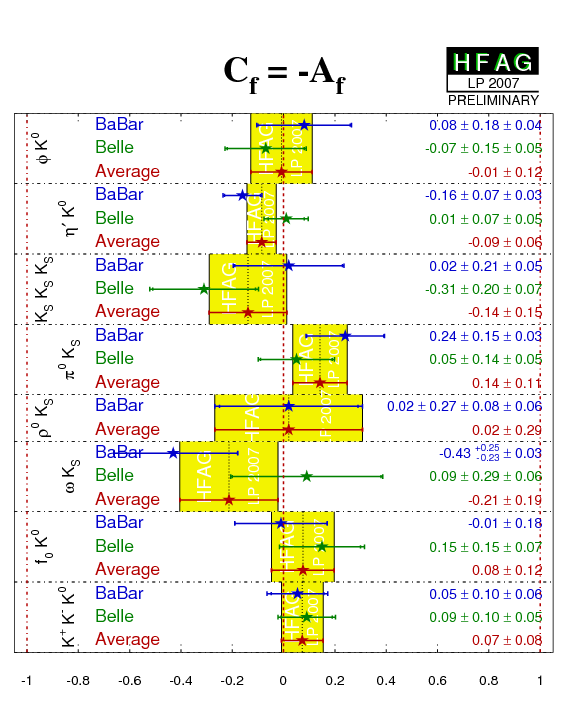
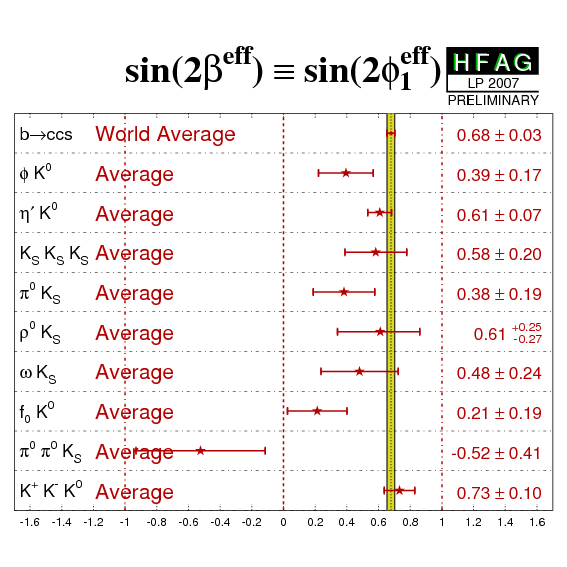
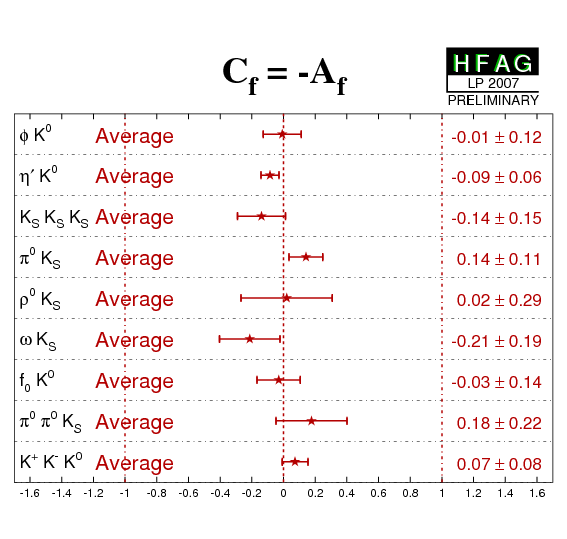
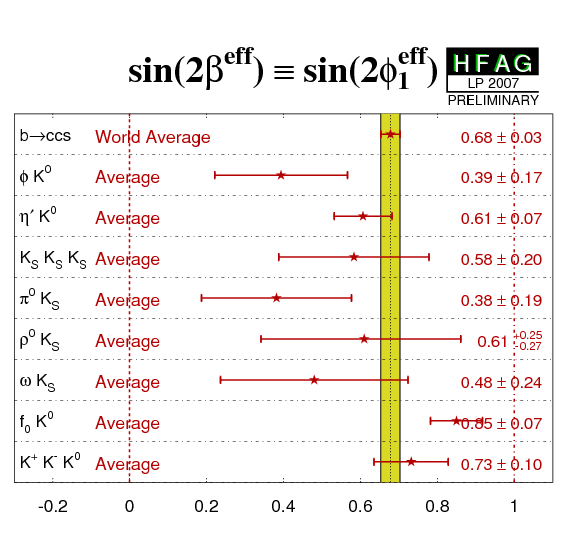
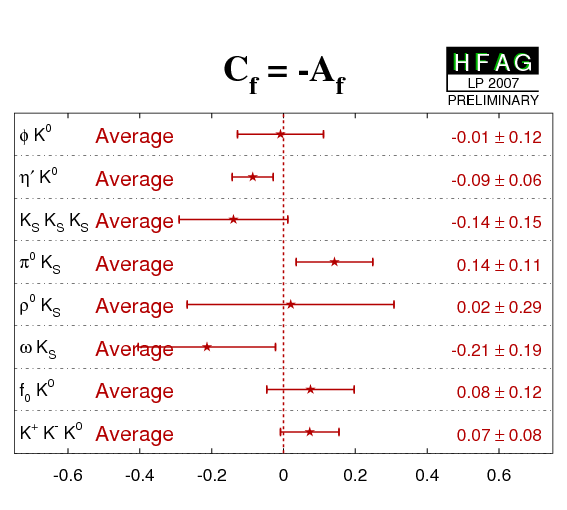
Within the Standard Model, the b → s penguin transition carries approximately the same weak phase as the b → cc-bar s amplitude used above to obtain sin(2β) ≡ sin(2φ1). When this single phase dominates the decay to a (quasi-)two-body CP eigenstate, the time-dependent CP violation parameters should therefore by given by S = -ηCP × sin(2βeff) ≡ -ηCP × sin(2φ1eff) and C ≡ -A = 0. The loop process is sensitive to effects from virtual new physics particles, which may result in deviations from the prediction that sin(2βeff) ≡ sin(2φ1eff) (b → qq-bar s) ∼ sin(2β) ≡ sin(2φ1) (b → cc-bar s).
Various different final states have been used by BaBar and Belle to investigate time-dependent CP violation in hadronic b → s penguin transitions. These are summarised below. (Note that results from time-dependent Dalitz plot analyses of B0 → K+K−K0 and B0 → π+π−KS are also discussed in the next section). The third error in the results for ρ0KS is due to Dalitz model uncertainty.
At present we do not apply a rescaling of the results to a common, updated set of input parameters. We take correlations between S and C into account where available, except if one or more of the measurements suffers from strongly non-Gaussian errors. In that case, we perform uncorrelated averages (using the PDG prescription for asymmetric errors).
| Mode | Experiment | sin(2βeff) ≡ sin(2φ1eff) | CCP | Correlation | Reference |
|---|---|---|---|---|---|
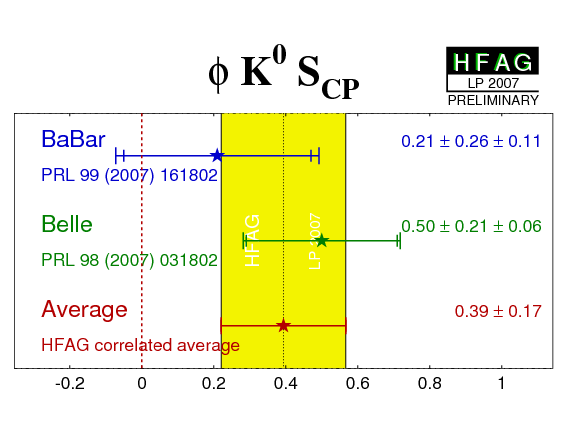
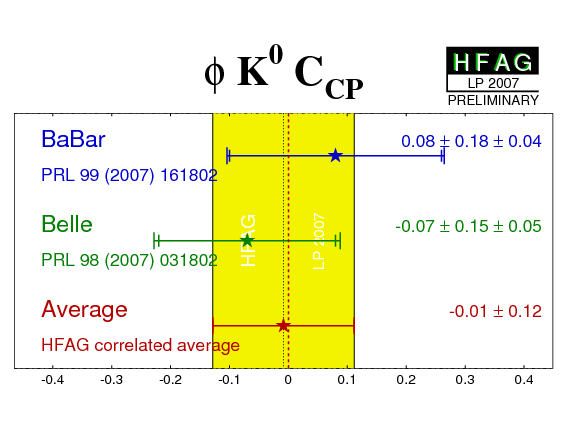
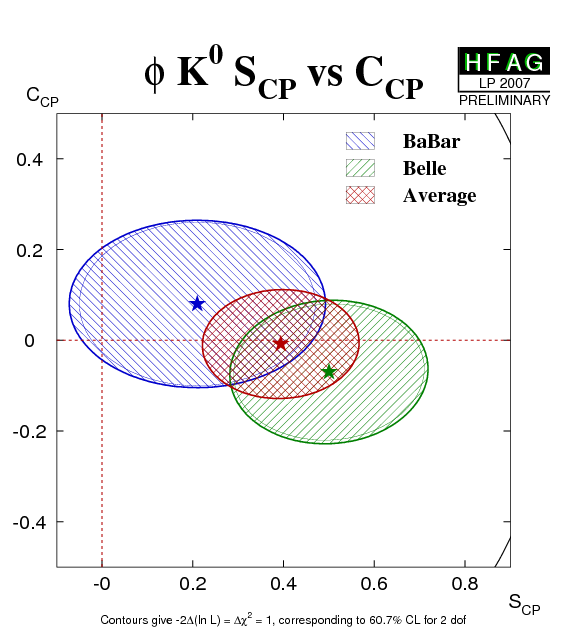
| φK0 |
BaBar
(*)
N(BB)=383M |
0.21 ± 0.26 ± 0.11 | 0.08 ± 0.18 ± 0.04 | - | PRL 99 (2007) 161802 |
|
Belle
N(BB)=535M |
0.50 ± 0.21 ± 0.06 | −0.07 ± 0.15 ± 0.05 | 0.05 (stat) | PRL 98 (2007) 031802 | |
| Average | 0.39 ± 0.17 | −0.01 ± 0.12 | 0.03 |
HFAG correlated average
χ2 = 1.1/2 dof (CL=0.59 ⇒ 0.5σ) |
|
|
|
eps.gz png | eps.gz png | eps.gz png | ||
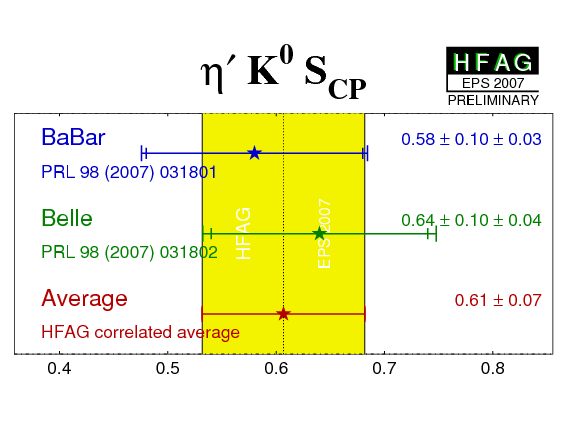
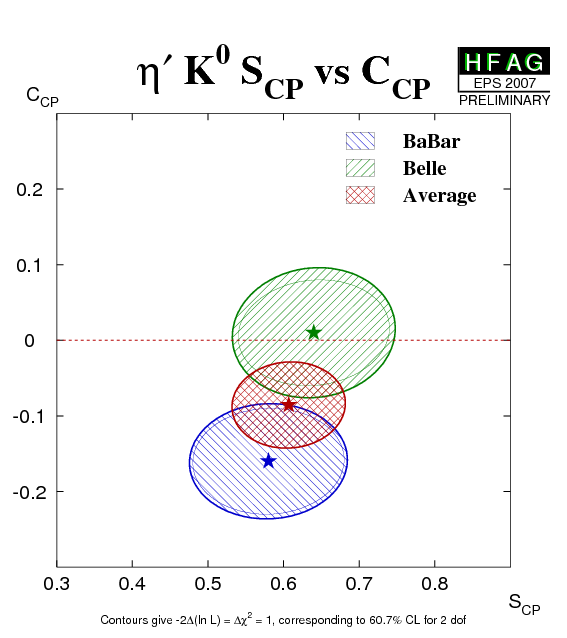
| η′K0 |
BaBar
N(BB)=384M |
0.58 ± 0.10 ± 0.03 | −0.16 ± 0.07 ± 0.03 | 0.03 (stat) | PRL 98 (2007) 031801 |
|
Belle
N(BB)=535M |
0.64 ± 0.10 ± 0.04 | 0.01 ± 0.07 ± 0.05 | 0.09 (stat) | PRL 98 (2007) 031802 | |
| Average | 0.61 ± 0.07 | −0.09 ± 0.06 | 0.04 |
HFAG correlated average
χ2 = 2.3/2 dof (CL=0.32 ⇒ 1.0σ) |
|
|
|
eps.gz png | eps.gz png | eps.gz png | ||
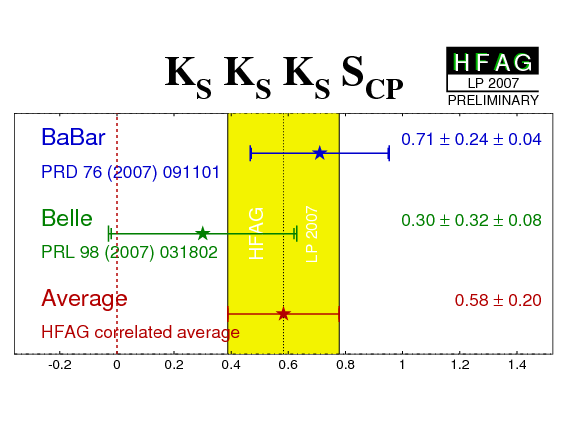
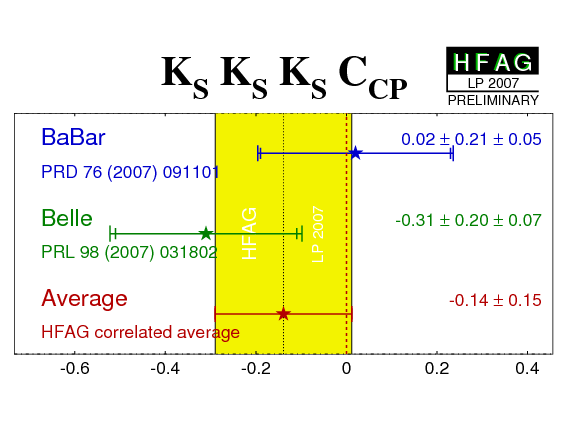
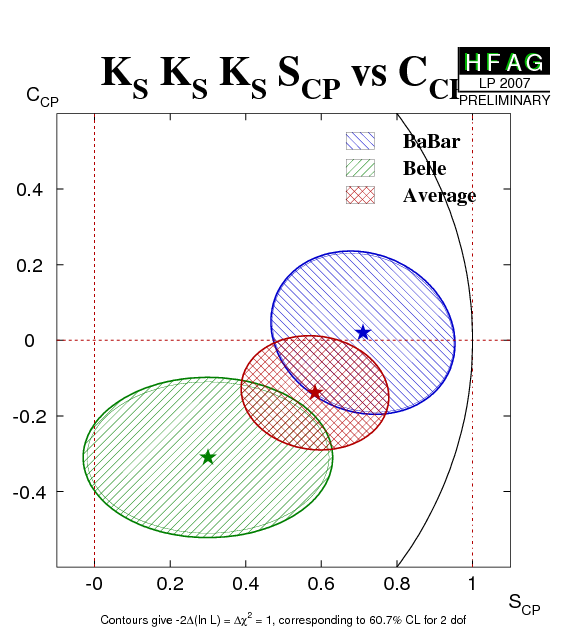
| KSKSKS |
BaBar
N(BB)=384M |
0.71 ± 0.24 ± 0.04 | 0.02 ± 0.21 ± 0.05 | −0.14 (stat) | PRD 76 (2007) 091101 |
|
Belle
N(BB)=535M |
0.30 ± 0.32 ± 0.08 | −0.31 ± 0.20 ± 0.07 | - | PRL 98 (2007) 031802 | |
| Average | 0.58 ± 0.20 | −0.14 ± 0.15 | −0.08 |
HFAG correlated average
χ2 = 2.3/2 dof (CL=0.31 ⇒ 1.0σ) |
|
|
|
eps.gz png | eps.gz png | eps.gz png | ||
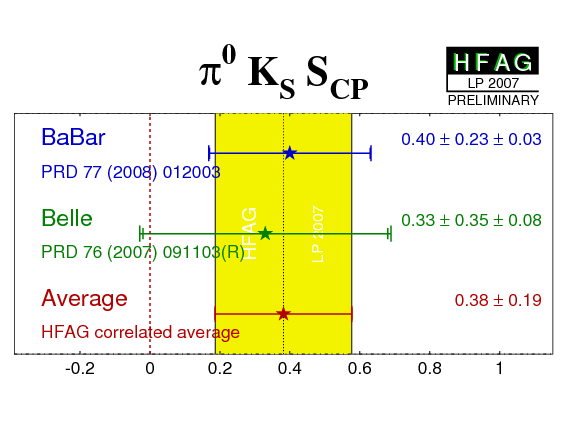
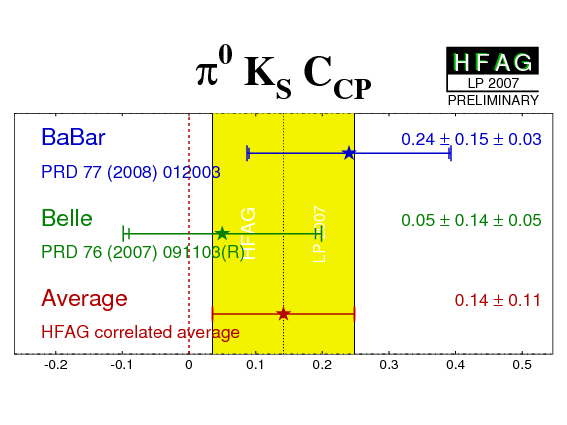
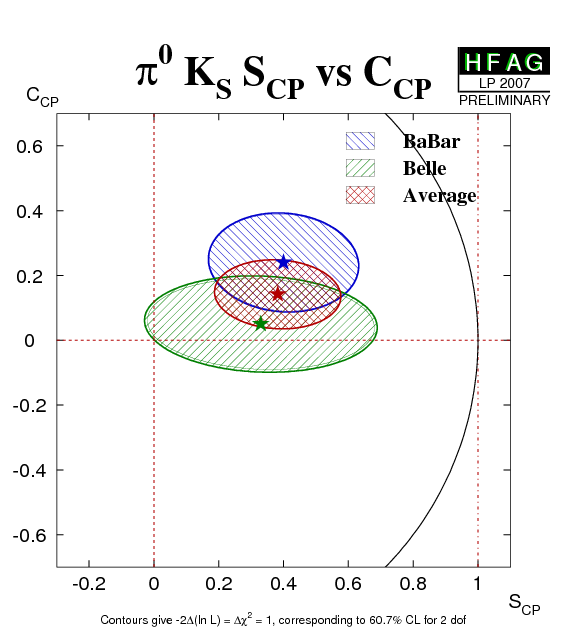
| π0KS |
BaBar
N(BB)=383M |
0.40 ± 0.23 ± 0.03 | 0.24 ± 0.15 ± 0.03 | −0.07 (stat) | PRD 77 (2008) 012003 |
|
Belle
N(BB)=535M |
0.33 ± 0.35 ± 0.08 | 0.05 ± 0.14 ± 0.05 | −0.08 (stat) | PRD 76 (2007) 091103(R) | |
| Average | 0.38 ± 0.19 | 0.14 ± 0.11 | −0.07 |
HFAG correlated average
χ2 = 0.9/2 dof (CL=0.66 ⇒ 0.5σ) |
|
|
|
eps.gz png | eps.gz png | eps.gz png | ||
| ρ0KS |
BaBar
(*)
N(BB)=383M |
0.61 +0.22 −0.24 ± 0.09 ± 0.08 | 0.02 ± 0.27 ± 0.08 ± 0.06 | - | arXiv:0708.2097 |
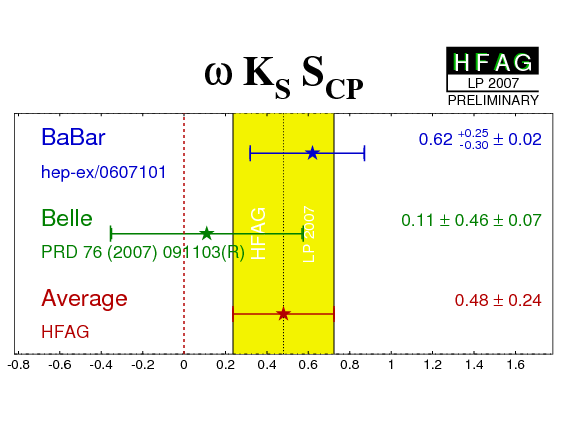
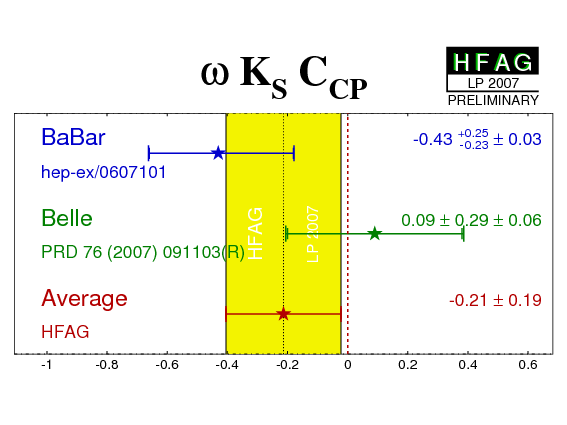
| ωKS |
BaBar
N(BB)=347M |
0.62 +0.25 −0.30 ± 0.02 | −0.43 +0.25 −0.23 ± 0.03 | - | hep-ex/0607101 |
|
Belle
N(BB)=535M |
0.11 ± 0.46 ± 0.07 | 0.09 ± 0.29 ± 0.06 | −0.04 (stat) | PRD 76 (2007) 091103(R) | |
| Average |
0.48 ± 0.24
χ2 = 0.9 (CL=0.35 ⇒ 0.9σ) |
−0.21 ± 0.19
χ2 = 1.8 (CL=0.18 ⇒ 1.3σ) |
uncorrelated averages | HFAG | |
|
|
eps.gz png | eps.gz png | . | ||
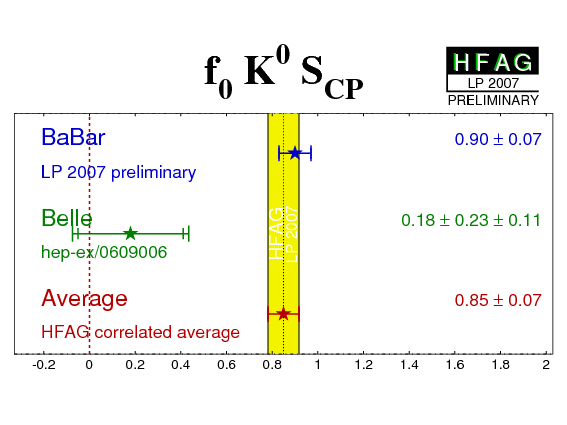
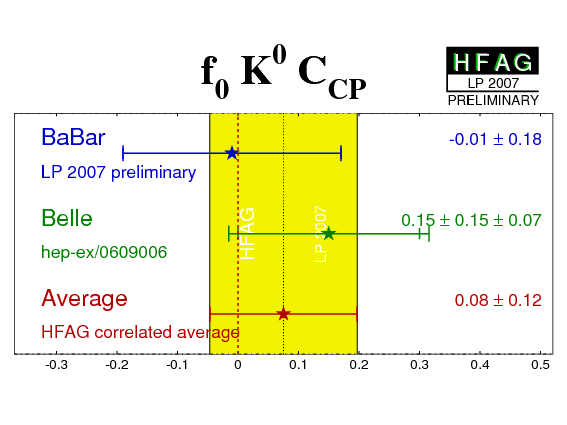
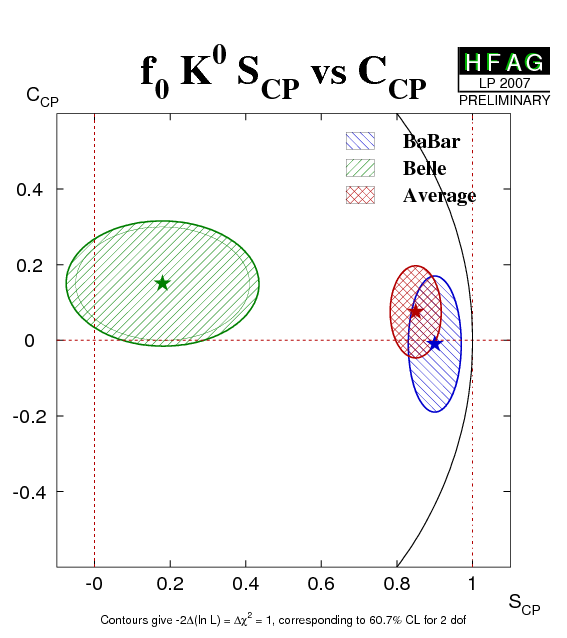
| f0K0 | BaBar (**) | 0.90 ± 0.07 | −0.01 ± 0.18 | - |
PRL 99 (2007) 161802,
arXiv:0708.2097 (**) |
|
Belle
N(BB)=535M |
0.18 ± 0.23 ± 0.11 | 0.15 ± 0.15 ± 0.07 | −0.01 (stat) | PRD 76 (2007) 091103(R) | |
| Average | 0.85 ± 0.07 | 0.08 ± 0.12 | −0.00 |
HFAG correlated average
χ2 = 7.8/2 dof (CL=0.02 ⇒ 2.3σ) |
|
|
|
eps.gz png | eps.gz png | eps.gz png | ||
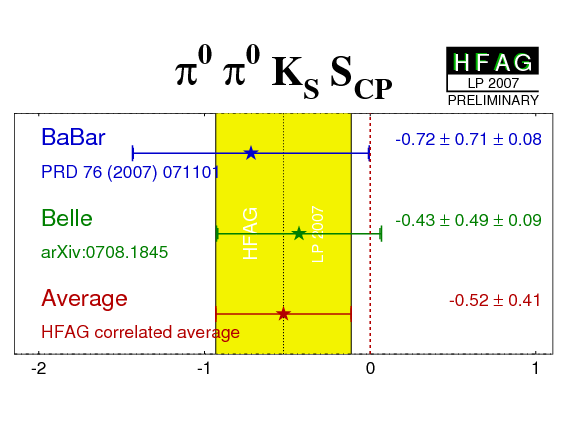
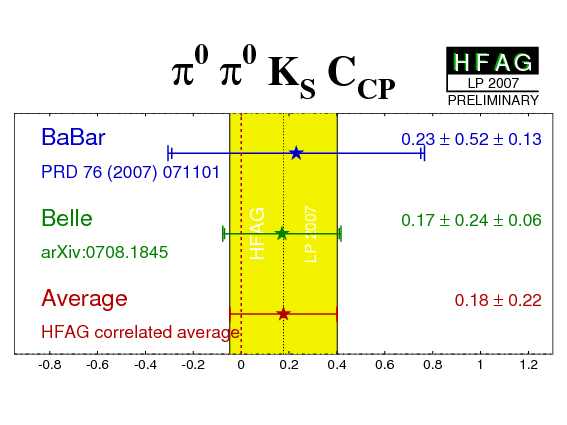
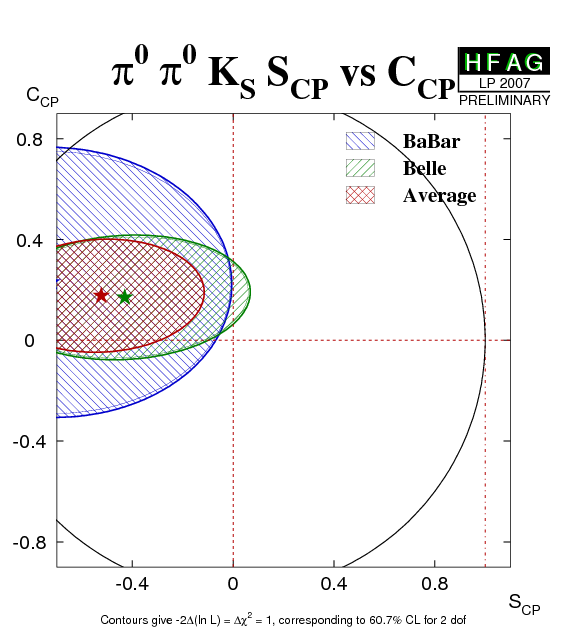
| π0π0KS |
BaBar
N(BB)=227M |
−0.72 ± 0.71 ± 0.08 | 0.23 ± 0.52 ± 0.13 | −0.02 (stat) | PRD 76 (2007) 071101 |
|
Belle
N(BB)=657M |
−0.43 ± 0.49 ± 0.09 | 0.17 ± 0.24 ± 0.06 | 0.09 (stat) | arXiv:0708.1845 | |
| Average | −0.52 ± 0.41 | 0.18 ± 0.22 | 0.06 |
HFAG correlated average
χ2 = 0.1/2 dof (CL=0.94 ⇒ 0.1σ) |
|
|
|
eps.gz png | eps.gz png | eps.gz png | ||
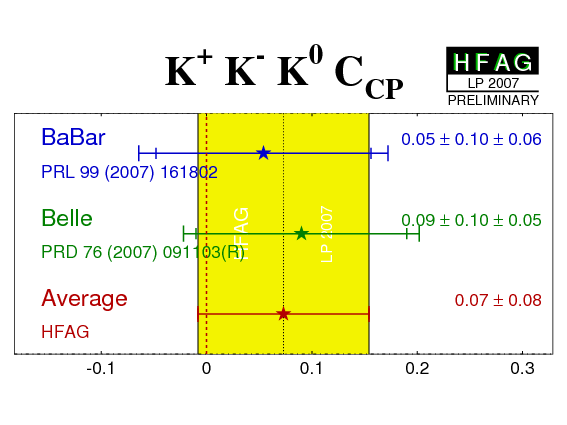
|
K+K−K0
(excluding φK0) |
BaBar
(*)
N(BB)=383M |
0.76 ± 0.11 +0.07 −0.04 | 0.05 ± 0.10 ± 0.06 | - | PRL 99 (2007) 161802 |
|
Belle
N(BB)=535M |
0.68 ± 0.15 ± 0.03+0.21 −0.13CP-even
(fCP-even= 0.93 ± 0.09 ± 0.05 [SU(2)]) |
0.09 ± 0.10 ± 0.05 | −0.00 (stat) | PRD 76 (2007) 091103(R) | |
| Average |
0.73 ± 0.10
χ2 = 0.2 (CL=0.67 ⇒ 0.4σ) |
0.07 ± 0.08
χ2 = 0.1 (CL=0.82 ⇒ 0.2σ) |
uncorrelated averages | HFAG | |
|
|
eps.gz png | eps.gz png | . | ||
| Naïve b→s penguin average |
0.68 ± 0.04
χ2 = 33/16 dof (CL=0.008 ⇒ 2.7σ) |
−0.01 ± 0.04
χ2 = 15/16 dof (CL=0.54 ⇒ 0.6σ) |
uncorrelated averages | HFAG | |
| eps.gz png | eps.gz png | ||||
| Direct comparison of charmonium and s-penguin averages (see comments below): χ2 = 0.01 (CL=0.93 ⇒ 0.1σ) | |||||
|
Naïve b→s penguin average (excluding results on f0KS from B0 → π+π−KS time-dependent Dalitz plot analysis) (***) |
0.56 ± 0.05
χ2 = 19/16 dof (CL=0.25 ⇒ 1.1σ) |
−0.02 ± 0.04
χ2 = 18/16 dof (CL=0.35 ⇒ 0.9σ) |
uncorrelated averages | HFAG | |
| eps.gz png | eps.gz png | ||||
| Direct comparison of charmonium and s-penguin averages (see comments below): χ2 = 4.9 (CL=0.03 ⇒ 2.2σ) | |||||
(*) The BaBar results for φK0 are determined from their time-dependent Dalitz plot analysis of B0 → K+K−K0. The BaBar results for ρ0KS are determined from their time-dependent Dalitz plot analysis of B0 → π+π−KS. The BaBar results for K+K−K0 are for the inclusive "high mass" (mK+K− > 1.1 GeV/c2) region in the time-dependent Dalitz plot analysis.
(**) The BaBar results for f0K0 are a combination of results from the two Dalitz plot analyses: sin(2βeff) = 0.25 ± 0.26 ± 0.10, CCP = −0.41 ± 0.23 ± 0.07 from B0 → f0K0 with f0 → K+K−, and sin(2βeff) = 0.94 +0.02−0.07 +0.03−0.05 ± 0.02, CCP = 0.35 ± 0.27 ± 0.07 ± 0.04 from B0 → f0KS with f0 → π+π−. Note that Q2B parameters extracted from Dalitz plot analyses are constrained to lie within the physical boundary (SCP2 + CCP2 < 1), and consequently the obtained errors are highly non-Gaussian when the central value is close to the boundary. This is particularly evident in the results from B0 → f0KS with f0 → π+π−. These results must be treated with extreme caution.
(***) Due to the highly non-Gaussian errors of the result from B0 → f0KS with f0 → π+π−, and the fact that this result has a significant effect on the χ2 of the naïve b→s penguin average (see comments below), we also calculate this average excluding the outlying point. In this case, the BaBar result on f0K0 is that from B0 → f0K0 with f0 → K+K−.
Please note that
| Compilation of results for −η×S ≈ sin(2βeff) ≡ sin(2φ1eff) and C from s-penguin decays. |
eps png |
eps png |
| Same, but excluding the outlying measurement of B0 → f0KS with f0 → π+π− (see comments above). |
|
|
| Same, but without π0π0KS and ρ0KS, to allow closer inspection of the detail. |
|
|
| Comparisons of averages in the different b→q q-bar s modes |
eps png |
eps png |
| Same, but excluding the outlying measurement of B0 → f0KS with f0 → π+π− (see comments above). |
|
|
| Same, but without π0π0KS and ρ0KS, to allow closer inspection of the detail. |
|
|
| 2D comparisons of averages in the different b→q q-bar s modes. |
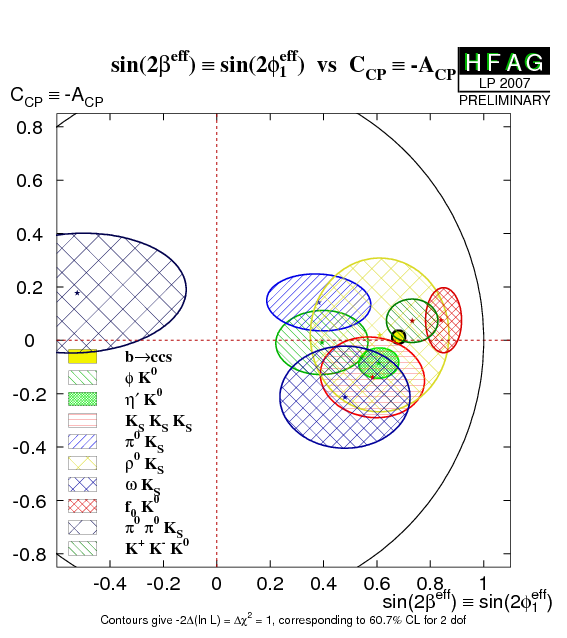
eps png |
|
Time-dependent amplitude analyses of the three-body decays Bd → K+K−K0 and Bd → π+π−K0 allow additional information to be extracted from the data. In particular, the cosine of the effective weak phase difference (cos(2βeff) ≡ cos(2φ1eff)) can be determined, as well as the sine term that is obtained from quasi-two-body analysis. This information allows half of the degenerate solutions to be rejected. Furthermore, Dalitz plot analysis has enhanced sensitivity to direct CP violation.
A time-dependent Dalitz plot analysis of B0 → K+K−K0 has been performed by BaBar. As given above, parameters can be extracted in a form that allows a straightforward comparison/combination with those from time-dependent CP asymmetries in quasi-two-body b → qq-bar s modes. In addition, the effective weak phase βeff ≡ φ1eff is directly determined for two significant resonant contributions: φK0 and f0K0, the inclusive "high mass" (mK+K− > 1.1 GeV/c2) region, as well as the effective weak phase averaged over the Dalitz plot, with the CP properties of the individual components taken into account. In addition to the weak phase, BaBar also measure the time-dependent direct CP violation parameter ACP ( = -CCP).
| Experiment | K+K−K0 (whole DP) | Reference | |
|---|---|---|---|
| βeff | ACP | ||
|
BaBar
N(BB)=383M |
0.352 ± 0.076 ± 0.026 | −0.015 ± 0.077 ± 0.053 | PRL 99 (2007) 161802 |
| Experiment | φK0 | f0K0 | K+K−K0 (mK+K− > 1.1 GeV/c2) | Reference | |||
|---|---|---|---|---|---|---|---|
| βeff | ACP | βeff | ACP | βeff | ACP | ||
|
BaBar
N(BB)=383M |
0.11 ± 0.14 ± 0.06 | −0.08 ± 0.18 ± 0.04 | 0.14 ± 0.15 ± 0.05 | 0.41 ± 0.23 ± 0.07 | 0.436 ± 0.087 +0.055−0.031 | −0.054 ± 0.102 ± 0.060 | PRL 99 (2007) 161802 |
From the above results BaBar infer that the trigonometric reflection at π/2 - &betaeff is disfavoured at 4.5σ.
A time-dependent Dalitz plot analysis of B0 → π+π−KS has been performed by BaBar. As given above, parameters can be extracted in a form that allows a straightforward comparison/combination with those from time-dependent CP asymmetries in quasi-two-body b → qq-bar s modes. In addition, the effective weak phase βeff ≡ φ1eff is directly determined for two significant resonant contributions: f0KS and ρ0KS. A number of additional parameters, for example relating to the Q2B modes K*+π−, are also extracted, but are not tabulated here.
The third error in the results given below is due to Dalitz model uncertainty.
| Experiment | βeff (f0KS) | βeff (ρ0KS) | Reference |
|---|---|---|---|
|
BaBar
N(BB)=383M |
(89 +22−20 ± 5 ± 8)° | (37 +19−17 ± 5 ± 6)° | arXiv:0708.2097 |
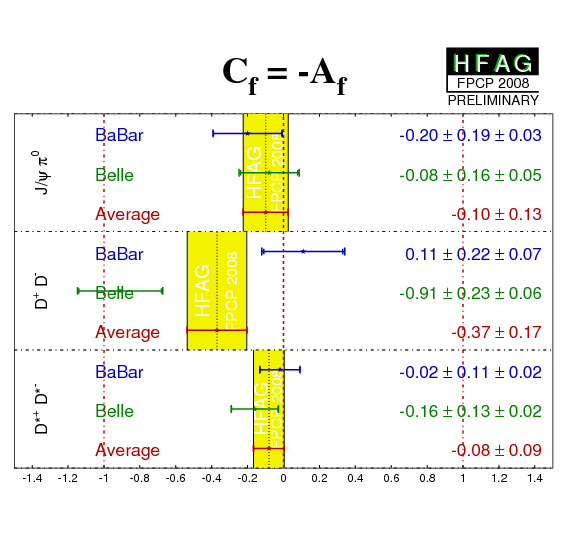
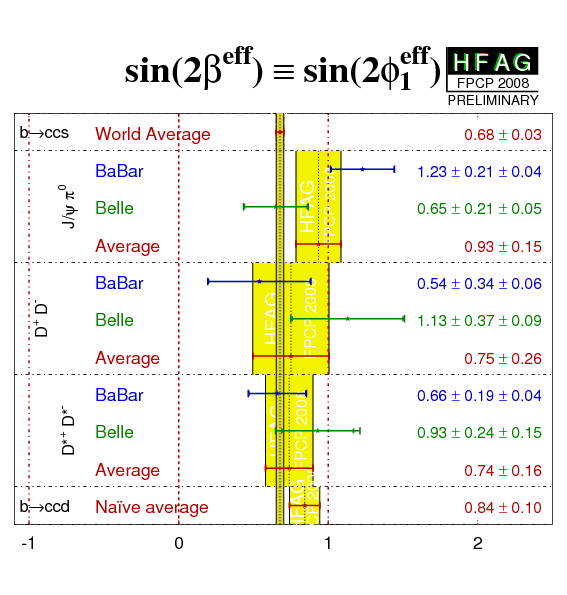
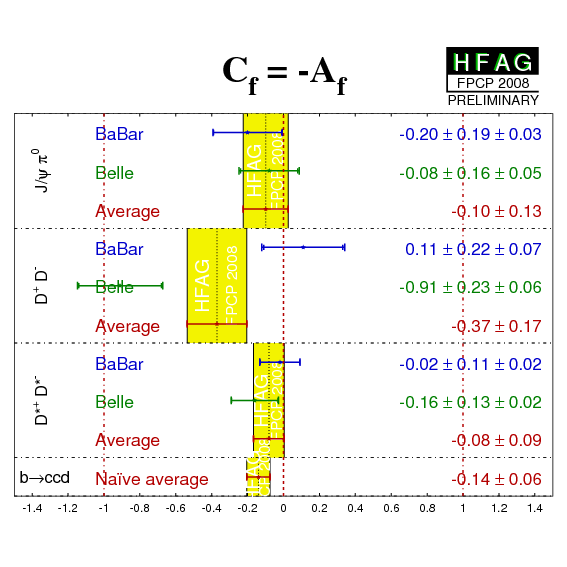
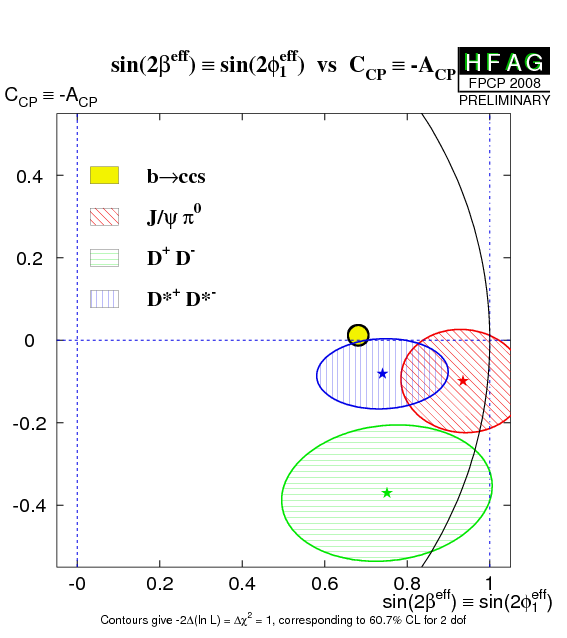
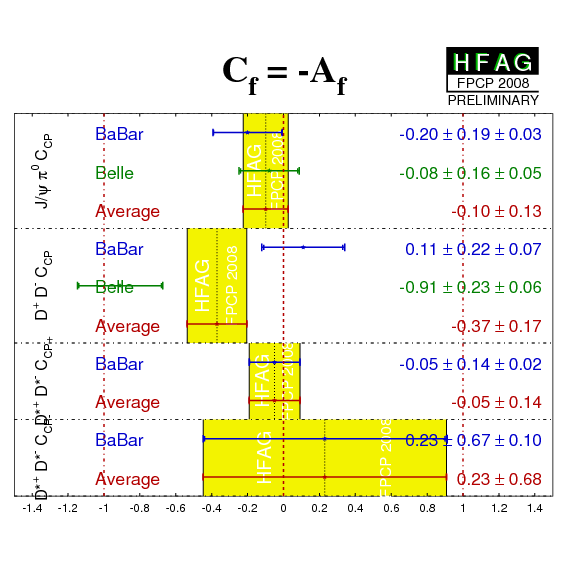
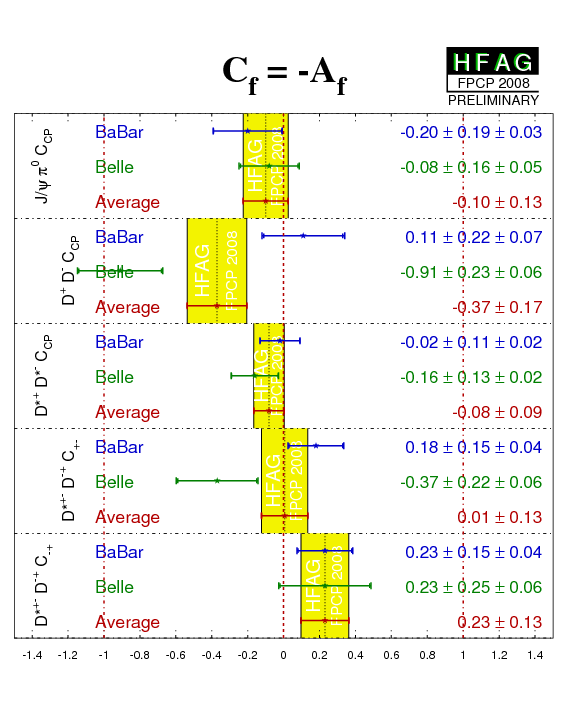
Due to possible significant penguin pollution, both the cosine and the sine coefficients of the Cabibbo-suppressed b → cc-bar d decays are free parameters of the theory. Absence of penguin pollution would result in Scc-bar d = − ηCP sin(2β) ≡ − ηCP sin(2φ1) and Ccc-bar d = 0 for the CP eigenstate final states (ηCP = +1 for both J/ψπ0 and D+D−). For the non-CP eigenstates D*+−D−+, absence of penguin pollution (ie. no direct CP violation) gives A = 0, C+ = −C− (but is not necessarily zero), S+ = 2 R sin(2β+δ)/(1+R2) and S− = 2 R sin(2β−δ)/(1+R2). [With alternative notation, S+ = 2 R sin(2φ1+δ)/(1+R2) and S− = 2 R sin(2φ1−δ)/(1+R2)]. Here R is the ratio of the magnitudes of the amplitudes for B0 → D*+D− and B0 → D*−D+, while δ is the strong phase between them. If there is no CP violation of any kind, then S+ = −S− (but is not necessarily zero). The vector-vector final state D*+D*− is a mixture of CP-even and CP-odd; the longitudinally polarized component is CP-even. Note that in the general case of non-negligible penguin contributions, the penguin-tree ratio and strong phase differences do not have to be the same for each helicity amplitude (likewise, they do not have to be the same for D*+D− and D*−D+).
At present we do not apply a rescaling of the results to a common, updated set of input parameters.
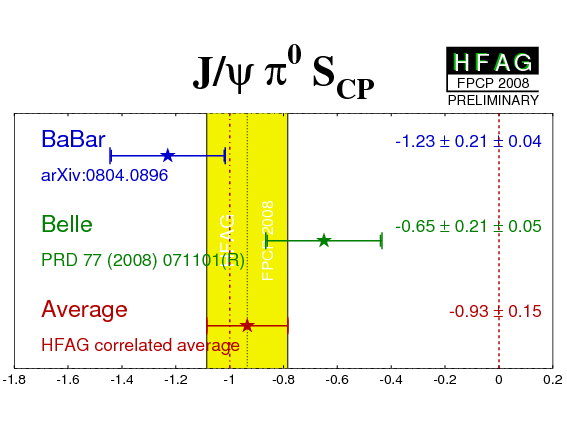
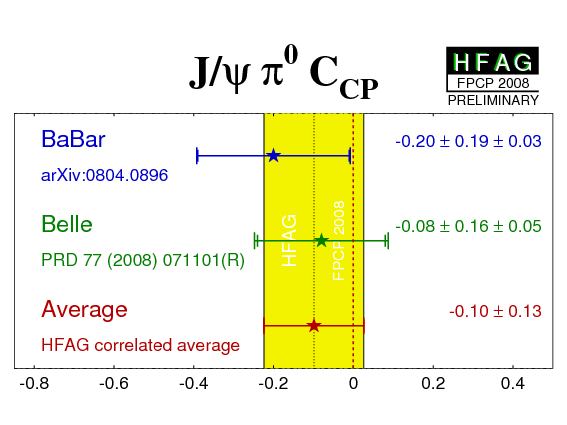
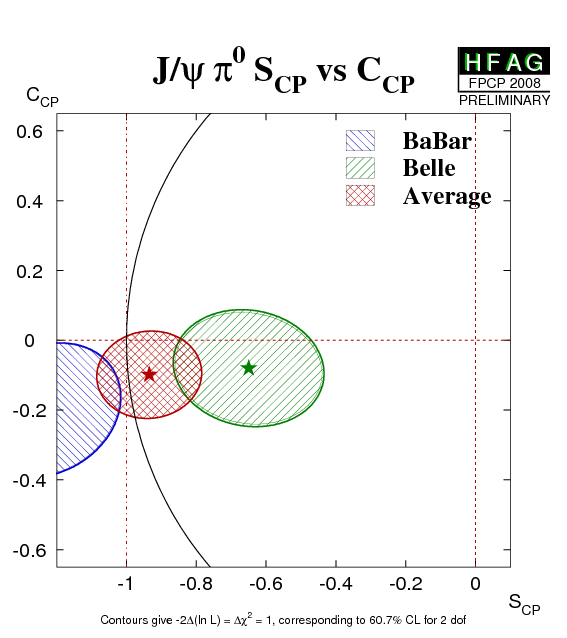
| Experiment | SCP (J/ψ π0) | CCP (J/ψ π0) | Correlation | Reference |
|---|---|---|---|---|
|
BaBar
N(BB)=466M |
−1.23 ± 0.21 ± 0.04 | −0.20 ± 0.19 ± 0.03 | 0.20 (stat) | arXiv:0804.0896 |
|
Belle
N(BB)=535M |
−0.65 ± 0.21 ± 0.05 | −0.08 ± 0.16 ± 0.05 | −0.10 (stat) | PRD 77 (2008) 071101(R) |
| Average | −0.93 ± 0.15 | −0.10 ± 0.13 | 0.04 |
HFAG correlated average
χ2 = 3.8/2 dof (CL=0.15 ⇒ 1.4σ) |
|
|
eps.gz png |
eps.gz png |
eps.gz png |
|
We recall that we do NOT rescale (inflate) the errors due to measurement inconsistencies.
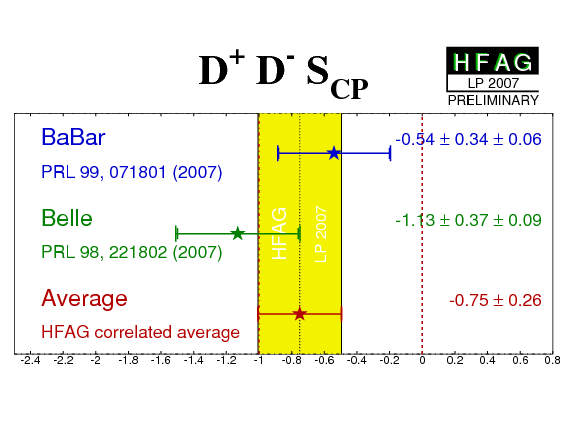
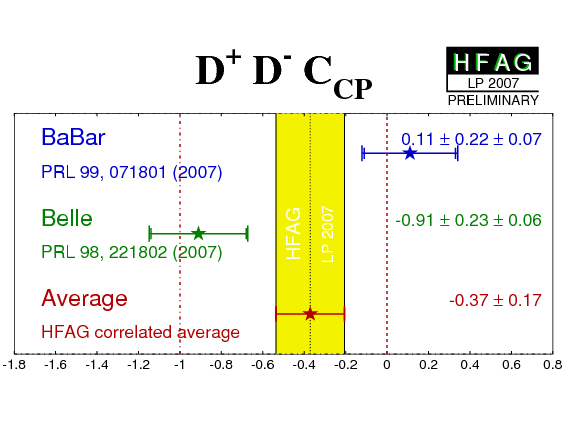
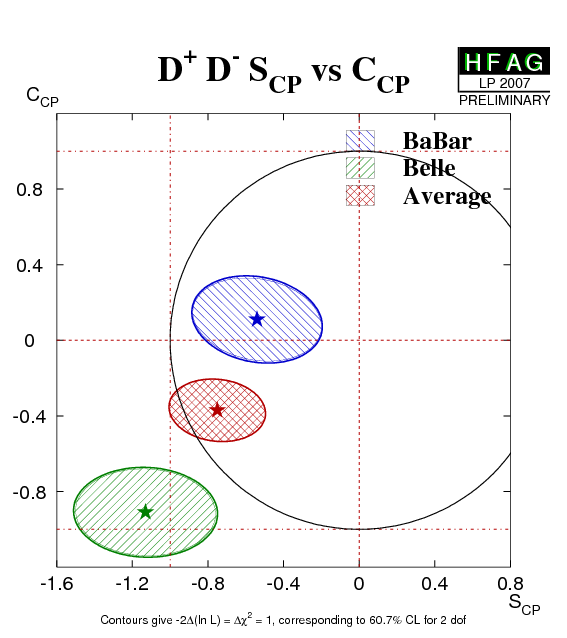
| Experiment | SCP (D+D−) | CCP (D+D−) | Correlation | Reference |
|---|---|---|---|---|
|
BaBar
N(BB)=364M |
−0.54 ± 0.34 ± 0.06 | 0.11 ± 0.22 ± 0.07 | −0.17 (stat) | PRL 99, 071801 (2007) |
|
Belle
N(BB)=535M |
−1.13 ± 0.37 ± 0.09 | −0.91 ± 0.23 ± 0.06 | −0.04 (stat) | PRL 98, 221802 (2007) |
| Average (*) | −0.75 ± 0.26 | −0.37 ± 0.17 | −0.10 |
HFAG correlated average
χ2 = 12/2 dof (CL=0.003 ⇒ 3.0σ) |
|
|
eps.gz png |
eps.gz png |
eps.gz png |
|
(*) Note that the Belle result is outside of the physical region, and the average is very close to the boundary. The interpretation of the average given above has to be done with the greatest care.
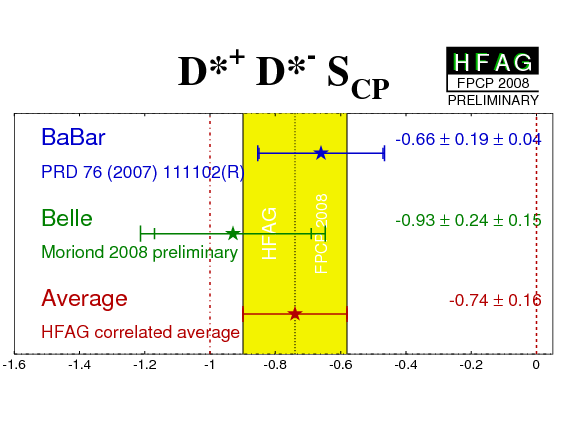
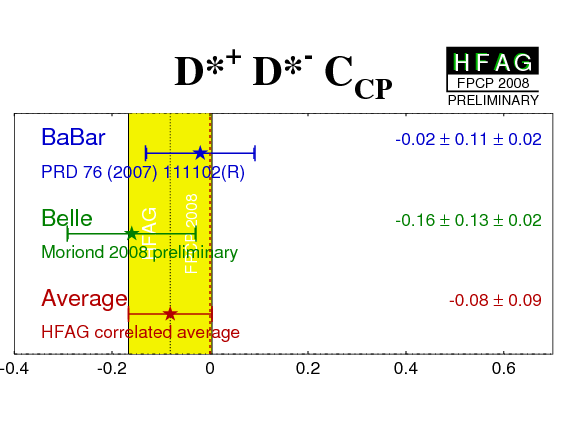
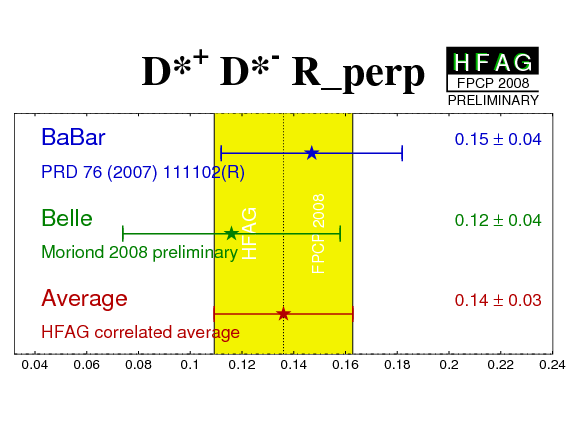
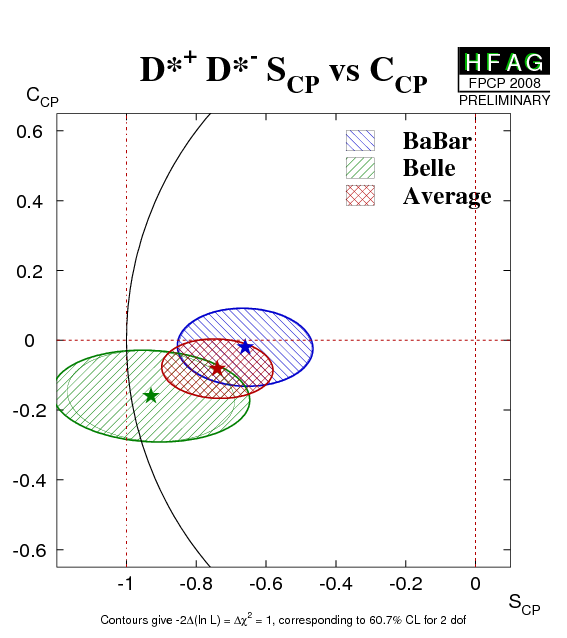
The vector particles in the pseudoscalar to vector-vector decay Bd → D*+D*− can have longitudinal and transverse relative polarization with different CP properties. The transversely polarized state (h⊥) is CP-odd, while the other two states in the transversity basis (h0 and h||) are CP-even. The CP parameters therefore have an important dependence on the fraction of the transversely polarized component R⊥.
In the most recent results, Belle performs an initial fit to determine the transversely polarized fraction R⊥, and then include effects due to its uncertainty together with other systematic errors. BaBar treat this variable as a free parameter in the fit and consequently this systematic is absorbed in the statistical error. We perform the average taking into account correlations of the CP parameters with each other as well as with R⊥, though we are obliged to assume that the correlations of the Belle results with R⊥ are negligible.
Belle have performed a fit to the data assuming that the CP parameters for CP-even and CP-odd transversity states are the same (up to a trivial change of sign for SCP). BaBar have performed two fits to the data: in addition to a fit as above, an additional fit relaxes this assumption, so that differences between CP-even and CP-odd parameters may be nontrivial. We use the first set of results to perform an average with Belle, and tabulate also the latter set of results.
| Experiment | SCP (D*+ D*−) | CCP (D*+ D*−) | R⊥ (D*+ D*−) | Correlation | Reference |
|---|---|---|---|---|---|
|
BaBar
N(BB)=383M |
−0.66 ± 0.19 ± 0.04 | −0.02 ± 0.11 ± 0.02 | 0.15 ± 0.04 (*) | (stat) | PRD 76 (2007) 111102(R) |
|
Belle
N(BB)=657M |
−0.93 ± 0.24 ± 0.15 | −0.16 ± 0.13 ± 0.02 | 0.12 ± 0.04 | (stat) | Moriond 2008 preliminary |
| Average | −0.74 ± 0.16 | −0.08 ± 0.09 | 0.14 ± 0.03 | (stat) |
HFAG correlated average
χ2 = 1.8/3 dof (CL=0.62 ⇒ 0.5σ) |
|
|
eps.gz png |
eps.gz png |
eps.gz png |
eps.gz png |
|
| Experiment | S+ (D*+ D*−) | C+ (D*+ D*−) | S− (D*+ D*−) | C− (D*+ D*−) | R⊥ (D*+ D*−) | Correlation | Reference |
|---|---|---|---|---|---|---|---|
|
BaBar
N(BB)=383M |
−0.72 ± 0.19 ± 0.05 | −0.05 ± 0.14 ± 0.02 | −1.83 ± 1.04 ± 0.23 | 0.23 ± 0.67 ± 0.10 | 0.14 ± 0.04 (*) | (stat) | PRD 76 (2007) 111102(R) |
(*) Note that the BaBar values of R⊥ in these tables are not corrected for efficiency; the efficiency corrected value is R⊥ = 0.143 ± 0.034 ± 0.008. (Belle measure RT = 0.116 ± 0.042 ± 0.004.)
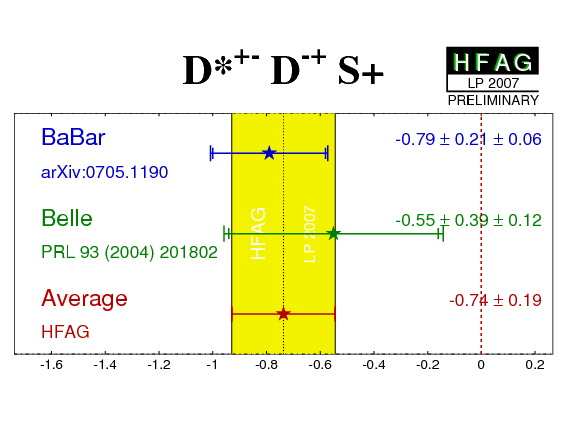
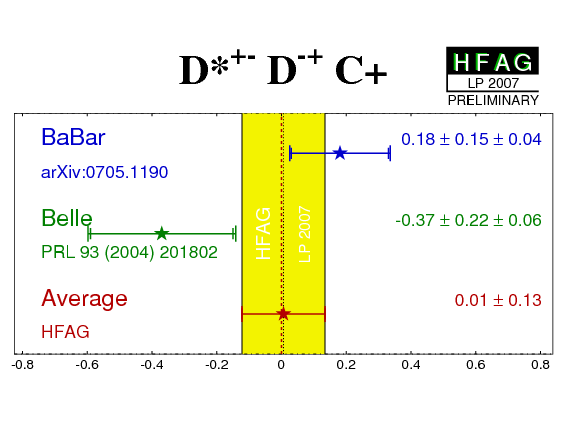
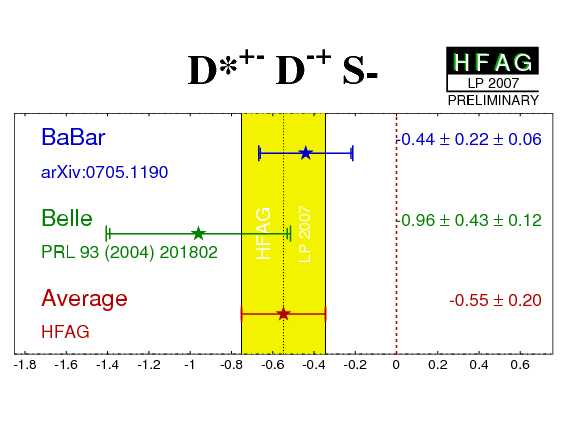
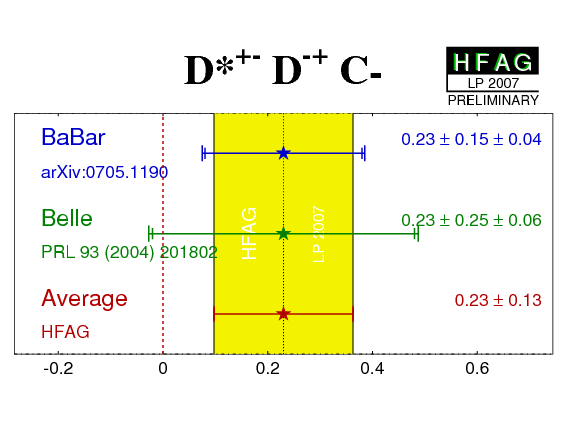
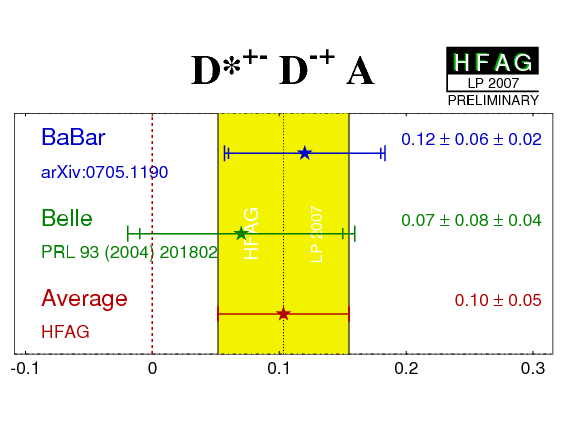
| Experiment | S+−(D*+D−) | C+−(D*+D−) | S−+(D*−D+) | C−+(D*−D+) | A(D*+−D−+) | Correlation | Reference |
|---|---|---|---|---|---|---|---|
|
BaBar
N(BB)=364M |
−0.79 ± 0.21 ± 0.06 | 0.18 ± 0.15 ± 0.04 | −0.44 ± 0.22 ± 0.06 | 0.23 ± 0.15 ± 0.04 | 0.12 ± 0.06 ± 0.02 | (stat) | PRL 99, 071801 (2007) |
|
Belle
N(BB)=152M (combined fully and partially rec. B decays) |
−0.55 ± 0.39 ± 0.12 | −0.37 ± 0.22 ± 0.06 | −0.96 ± 0.43 ± 0.12 | 0.23 ± 0.25 ± 0.06 | 0.07 ± 0.08 ± 0.04 | - | PRL 93 (2004) 201802 |
| Average |
−0.74 ± 0.19
χ2 = 0.3 (CL=0.60 ⇒ 0.5σ) |
0.01 ± 0.13
χ2 = 4.0 (CL=0.05 ⇒ 2.0σ) |
−0.55 ± 0.20
χ2 = 1.1 (CL=0.30 ⇒ 1.0σ) |
0.23 ± 0.13
χ2 = 0.0 (CL=1.00 ⇒ 0.0σ) |
0.10 ± 0.05
χ2 = 0.2 (CL=0.65 ⇒ 0.5σ) |
uncorrelated averages | HFAG |
|
|
eps.gz png | eps.gz png | eps.gz png | eps.gz png | eps.gz png | . | |
| Compilation of results for (left) sin(2βeff) ≡ sin(2φ1eff) = −ηCPS and (right) C ≡ −A from time-dependent b → cc-bar d analyses with CP eigenstate final states. The results are compared to the values from the corresponding charmonium averages. |
eps.gz png |
eps.gz png |
||||
| Same, but with separate CP-even and CP-odd results from D*+D*− |
|
|
||||
|
Same, but including results from
D*+−D*−+.
(These measure the same quantity as other b → cc-bar d modes when the strong phase difference between the two decay amplitudes vanishes. This is in addition to the usual assumption of negligible penguin contributions.) |
|
|
||||
Same, but including a naïve b → c c-bar d average.
Such an average assumes that penguin contributions to the
b → c c-bar d decays are negligible.
See the cautionary comments in the discussion on averaging
the time-dependent CP violation parameters for
b → qq-bar s transitions above.
The results of the naïve average are
|
eps.gz png |
eps.gz png |
||||
| 2D comparisons of averages in the different b→c c-bar d modes. |
eps png |
|||||
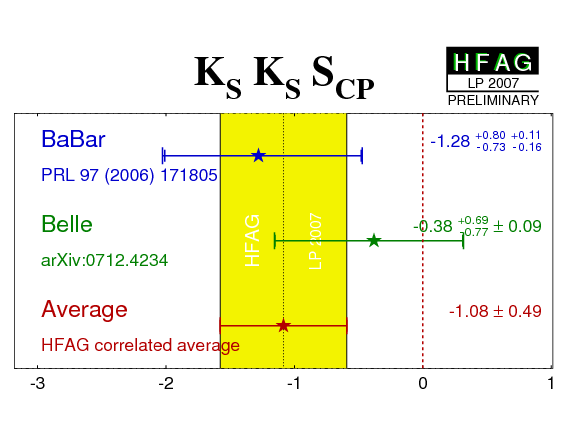
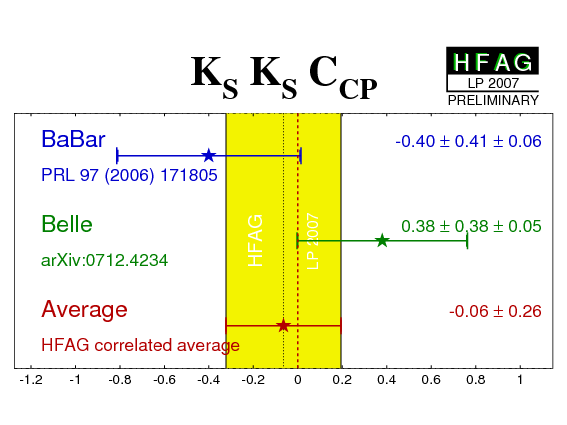
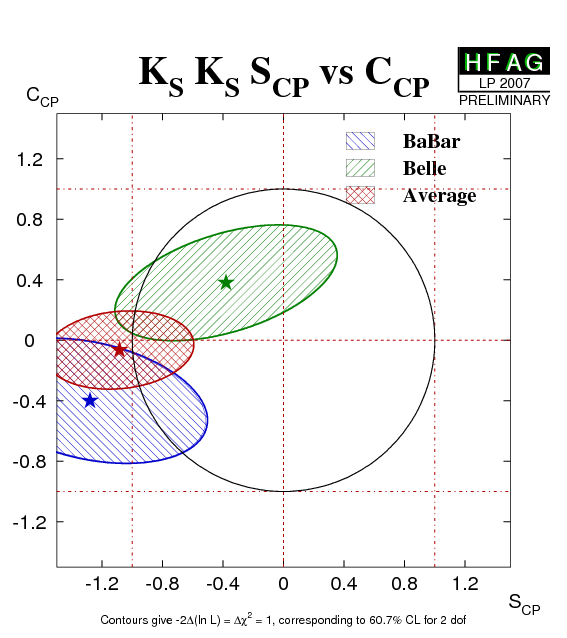
The b → qq-bar d penguin transitions are suppressed in the Standard Model, leading to small numbers of events available in these final states. If the top quark dominates in the loop, the phase in the decay amplitude (β ≡ φ1) cancels that in the B0–B0-bar mixing, so that S = C = 0. However, even within the Standard Model, there may be non-negligible contributions with u or c quarks in the penguin loop (or from rescattering, etc.) so that different values of S and C are possible. In this case, these can be used to obtain constraints on γ ≡ φ3, and hence test if any non-Standard Model contributions are present.
At present we do not apply a rescaling of the results to a common, updated set of input parameters.
| Experiment | SCP (KSKS) | CCP (KSKS) | Correlation | Reference |
|---|---|---|---|---|
|
BaBar
N(BB)=350M |
−1.28 +0.80 −0.73 +0.11 −0.16 | −0.40 ± 0.41 ± 0.06 | −0.32 (stat) | PRL 97 (2006) 171805 |
|
Belle
N(BB)=657M |
−0.38 +0.69 −0.77 ± 0.09 | 0.38 ± 0.38 ± 0.05 | 0.48 (stat) | arXiv:0712.4234 |
| Average | −1.08 ± 0.49 | −0.06 ± 0.26 | 0.14 |
HFAG correlated average
χ2 = 2.5/2 dof (CL=0.29 ⇒ 1.1σ) |
|
|
eps.gz png |
eps.gz png |
eps.gz png |
|
(*) Note that the BaBar result is outside of the physical region, as is the average. The interpretation of the results given above has to be done with the greatest care.
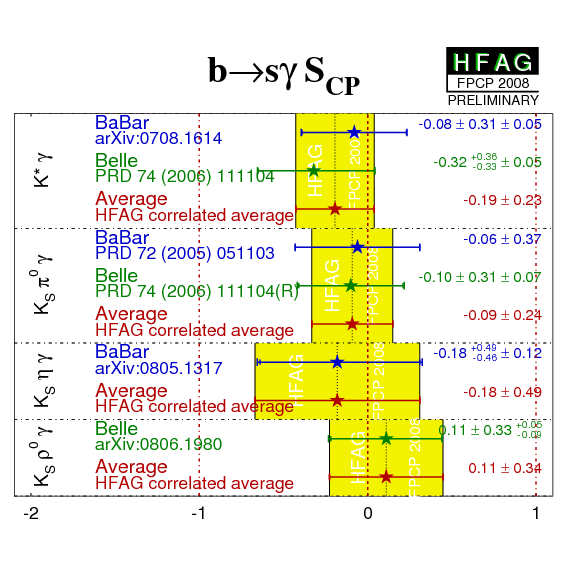
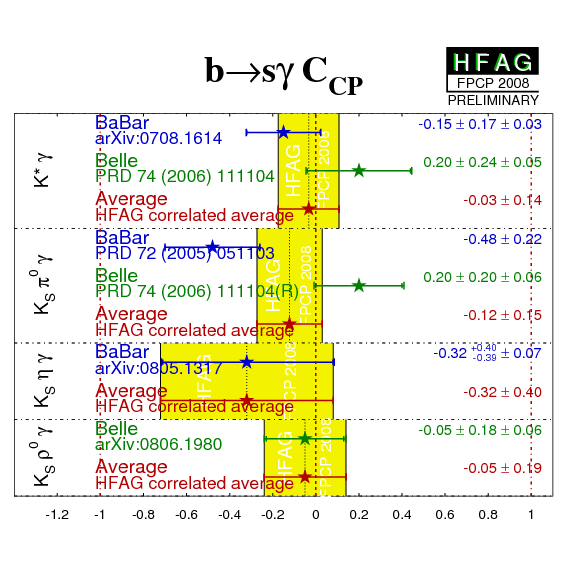
Time-dependent analyses of radiative b decays such as B0→ KSπ0γ, probe the polarization of the photon. In the SM, the photon helicity is dominantly left-handed for b → sγ, and right-handed for the conjugate process. As a consequence, B0 → KSπ0γ behaves like an effective flavor eigenstate, and mixing-induced CP violation is expected to be small - a simple estimation gives: S ~ −2(ms/mb)sin(2β) ≡ −2(ms/mb)sin(2φ1) (with an assumption that the Standard Model dipole operator is dominant). Corrections to the above may allow values of S as large as 10% in the SM.
Atwood et al. have shown that (with the same assumption) an inclusive analysis with respect to KSπ0 can be performed, since the properties of the decay amplitudes are independent of the angular momentum of the KSπ0 system. However, if non-dipole operators contribute significantly to the amplitudes, then the Standard Model mixing-induced CP violation could be larger than the expectation given above, and the CPV parameters may vary slightly over the KSπ0γ Dalitz plot, for example as a function of the KSπ0 invariant mass.
An inclusive KSπ0γ analysis has been performed by Belle using the invariant mass range up to 1.8 GeV/c2. Belle also gives results for the K*(892) region: 0.8 GeV/c2 to 1.0 GeV/c2. BABAR has measured the CP-violating asymmetries separately within and outside the K*(892) mass range: 0.8 GeV/c2 to 1.0 GeV/c2 is again used for K*(892)γ candidates, while events with invariant masses in the range 1.1 GeV/c2 to 1.8 GeV/c2 are used in the "KSπ0γ (not K*(892)γ)" analysis. A recent update gives results inside the K*(892) mass range only.
We quote two averages: one for K*(892) only, and the other one for the inclusive KSπ0γ decay (including the K*(892)). In the former we include the most recent results from BABAR, while in the latter we use the previously published results. If the Standard Model dipole operator is dominant, both should give the same quantities (the latter naturally with smaller statistical error). If not, care needs to be taken in interpretation of the inclusive parameters; while the results on the K*(892) resonance remain relatively clean.
In addition to results with the KSπ0γ final state, BABAR has results using KSηγ, while Belle has results using KSρ0γ.
At present we do not apply a rescaling of the results to a common, updated set of input parameters.
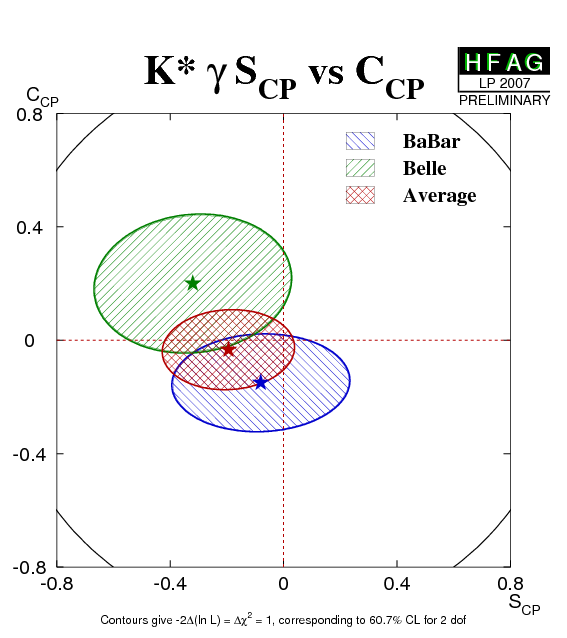
| Mode | Experiment | SCP (b → sγ) | CCP (b → sγ) | Correlation | Reference | ||
|---|---|---|---|---|---|---|---|
| K*(892)γ |
BaBar
N(BB)=431M |
−0.08 ± 0.31 ± 0.05 | −0.15 ± 0.17 ± 0.03 | 0.05 (stat) | arXiv:0708.1614 | ||
|
Belle
N(BB)=535M |
−0.32 +0.36 −0.33 ± 0.05 | 0.20 ± 0.24 ± 0.05 | 0.08 (stat) | PRD 74 (2006) 111104 | |||
| Average | −0.19 ± 0.23 | −0.03 ± 0.14 | 0.06 |
HFAG correlated average
χ2 = 1.7/2 dof (CL=0.43 ⇒ 0.8σ) |
|||
|
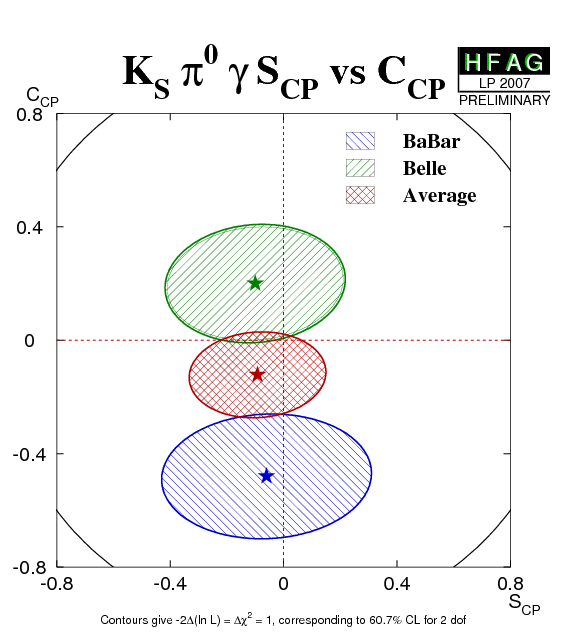
KSπ0γ
(incl. K*γ) |
BaBar
N(BB)=232M |
−0.06 ± 0.37 | −0.48 ± 0.22 | 0.05 (stat) | PRD 72 (2005) 051103 | ||
|
Belle
N(BB)=535M |
−0.10 ± 0.31 ± 0.07 | 0.20 ± 0.20 ± 0.06 | 0.08 (stat) | PRD 74 (2006) 111104(R) | |||
| Average | −0.09 ± 0.24 | −0.12 ± 0.15 | 0.06 |
HFAG correlated average
χ2 = 5.1/2 dof (CL=0.08 ⇒ 1.8σ) |
|||
| KS η γ |
BaBar
N(BB)=465M |
−0.18 +0.49 −0.46 ± 0.12 | −0.32 +0.40 −0.39 ± 0.07 | −0.17 (stat) | arXiv:0805.1317 | ||
| KS ρ0 γ |
Belle
N(BB)=657M |
0.11 ± 0.33 +0.05 −0.09 | −0.05 ± 0.18 ± 0.06 | 0.04 (stat) | arXiv:0806.1980 | ||
|
|
eps.gz png |
eps.gz png |
|
||||
Similar to the b → sγ transitions discussed above, time-dependent analyses of radiative b decays such as B0→ ρ0γ probe the polarization of the photon emitted in radiative b → dγ decays. However, since the CP violating phase from the b → d decay amplitude cancels that from the Bd–Bd-bar mixing (to an approximation that is exact in the limit of top quark dominance in the loops), the asymmetry is suppressed even further in the Standard Model. An observable signal would be a sign of a new physics amplitude emitting right-handed photons and carrying a new CP violating phase.
A time-dependent analysis of the B0→ ρ0γ channel has been carried out by Belle.
At present we do not apply a rescaling of the results to a common, updated set of input parameters.
| Experiment | SCP (b → dγ) | CCP (b → dγ) | Correlation | Reference |
|---|---|---|---|---|
|
Belle
N(BB)=657M |
−0.83 ± 0.65 ± 0.18 | 0.44 ± 0.49 ± 0.14 | −0.08 (stat) | PRL 100 (2008) 021602 |
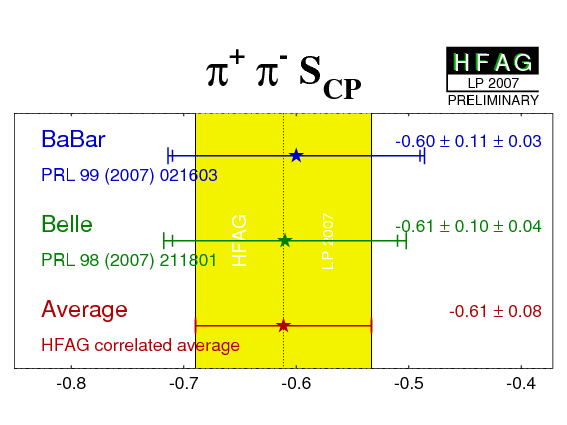
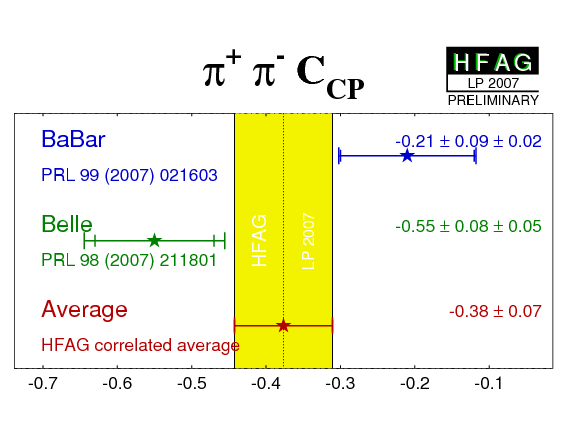
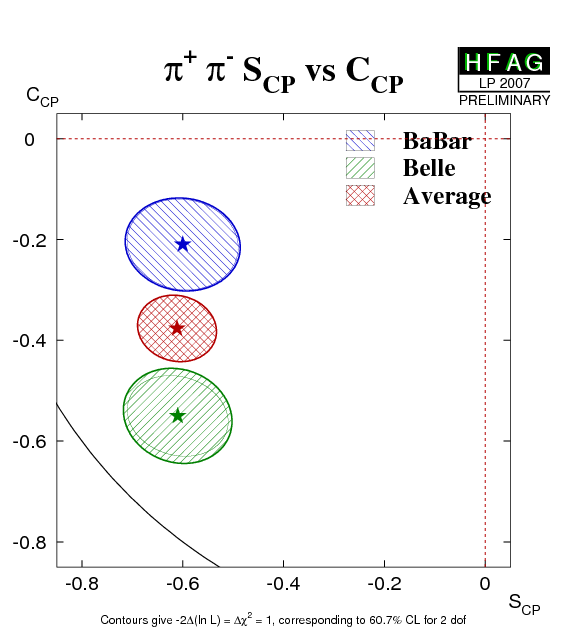
Please note that at present we do not apply a rescaling of the results to a common, updated set of input parameters. Correlation due to common systematics are neglected in the following averages. We recall that we do NOT rescale (inflate) the errors due to measurement inconsistencies.
| Experiment | SCP (π+π−) | CCP (π+π−) | Correlation | Reference |
|---|---|---|---|---|
|
BaBar
N(BB)=383M |
−0.60 ± 0.11 ± 0.03 | −0.21 ± 0.09 ± 0.02 | −0.07 (stat) | PRL 99 (2007) 021603 |
|
Belle
N(BB)=535M |
−0.61 ± 0.10 ± 0.04 | −0.55 ± 0.08 ± 0.05 | −0.15 (stat) | PRL 98 (2007) 211801 |
| Average | −0.61 ± 0.08 | −0.38 ± 0.07 | −0.09 |
HFAG correlated average
χ2 = 6.7/2 dof (CL=0.034 ⇒ 2.1σ) |
|
|
eps.gz png |
eps.gz png |
eps.gz png |
|
Interpretations:
The
Gronau-London
isospin analysis allows a constraint on α ≡ φ2
to be extracted from the ππ system even in the presence of non-negligible
penguin contributions.
The analysis involves the SU(2) partners of
the Bd→ π+π− decay.
The relevant branching ratios (given in units of 10−6)
and CP-violating charge asymmetries are taken from
HFAG - Rare Decays.
| BR(B0 → π+π−) = 5.2 ± 0.2 | - |
| BR(B+ → π+π0) = 5.6 ± 0.4 | ACP(B+ → π+π0) = 0.06 ± 0.05 |
| BR(B0 → π0π0) = 1.3 ± 0.2 | ACP(B0 → π0π0) = 0.48 +0.32−0.31 |
Belle
exclude the range 9° < φ2 < 81° at the 95.4% confidence level.
BaBar
give a confidence level interpretation for α,
exclude the range 25° < α < 66° at the 90% confidence level,
and find the solution consistent with the Standard Model to be
α = (96 +10−6)°.
NB. It is implied in the above constraints on α ≡ φ2 that a mirror solution at α → α + π ≡ φ2 → φ2 + π also exists.
For more details on the world average for α ≡ φ2, calculated with different statistical treatments, refer to the CKMfitter and UTfit pages.
Both BaBar and Belle have performed a full time-dependent Dalitz plot analyses of the decay Bd → (ρπ)0 → π+π−π0, which allows to simultaneously determine the complex decay amplitudes and the CP-violating weak phase α ≡ φ2. The analysis follows the idea of Snyder and Quinn (1993), implemented as suggested by Quinn and Silva. The experiments determine 27 coefficients of the form factor bilinears from the fit to data. Physics parameters, such as the quasi-two-body parameters, and the phases δ+−=arg[A−+A+−*] and the UT angle α ≡ φ2, are determined from subsequent fits to the bilinear coefficients.
Please note that at present we do not apply a rescaling of the results to a common, updated set of input parameters. Correlation due to common systematics are neglected in the following averages.
| [The table of averages of the form factor bilinears is suppressed here for the benefit of the nonspecialist. Those interested in the details can find them here.] |
| Compilation of averages of the form factor bilinears. |
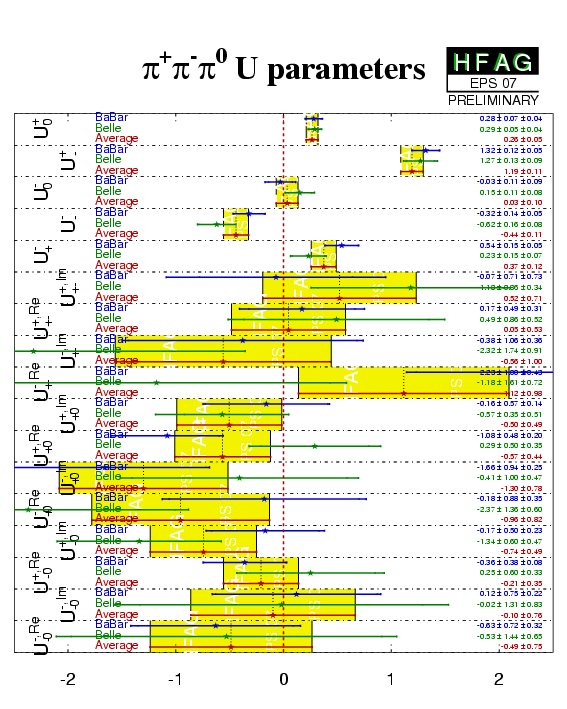
eps.gz png |
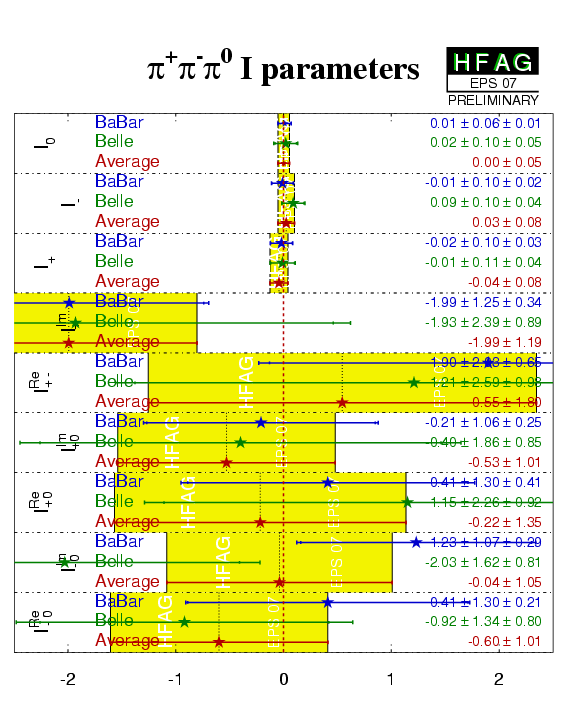
eps.gz png |
From the bilinear coefficients given above, both experiments extract "quasi-two-body" (Q2B) parameters. Considering only the charged ρ bands in the Dalitz plot, the Q2B analysis involves 5 different parameters, one of which − the charge asymmetry ACP(ρπ) − is time-independent. The time-dependent decay rate is given by
where Qtag=+1(−1) when the tagging meson is a B0 (B0-bar). CP symmetry is violated if either one of the following conditions is true: ACP(ρπ)≠0, Cρπ≠0 or Sρπ≠0. The first two correspond to CP violation in the decay, while the last condition is CP violation in the interference of decay amplitudes with and without Bd mixing.
We average the quasi-two-body parameters provided by the experiments, which should be equivalent to determining average values directly from the averaged bilinear coefficients.
As shown by
Charles
it can be convenient to transform the experimentally motivated
CP parameters ACP(ρπ) and Cρπ
into the physically motivated choices
A+−(ρπ) =
(|κ+−|2−1)/(|κ+−|2+1) =
−(ACP(ρπ)+Cρπ+ACP(ρπ)ΔCρπ)/(1+ΔCρπ + ACP(ρπ)Cρπ),
A−+(ρπ) =
(|κ−+|2−1)/(|κ−+|2+1) =
(−ACP(ρπ)+Cρπ+ACP(ρπ)ΔCρπ)/(−1+ΔCρπ + ACP(ρπ)Cρπ),
where
κ+− = (q/p)Abar−+/A+− and
κ−+ = (q/p)Abar+−/A−+.
With this definition A−+(ρπ) (A+−(ρπ))
describes CP violation in Bd decays
where the ρ is emitted (not emitted) by the spectator interaction.
Both experiments obtain values for A+− and A−+,
which we average.
Again, this procedure should be equivalent to extracting these values
directly from the previous results.
In addition to the Bd→ ρ+−π−+ quasi-two-body contributions to the π+π−π0 final state, there can also be a Bd→ ρ0π0 component. Both experiments have also extracted the quasi-two-body parameters associated with this intermediate state.
Note again that at present we do not apply a rescaling of the results to a common, updated set of input parameters. Correlations due to possible common systematics are neglected in the following averages.
The citation given for Belle in the tables below corresponds to a short article published in PRL. A more detailed article on the same analysis is also available as arXiv:0710.4974 [hep-ex].
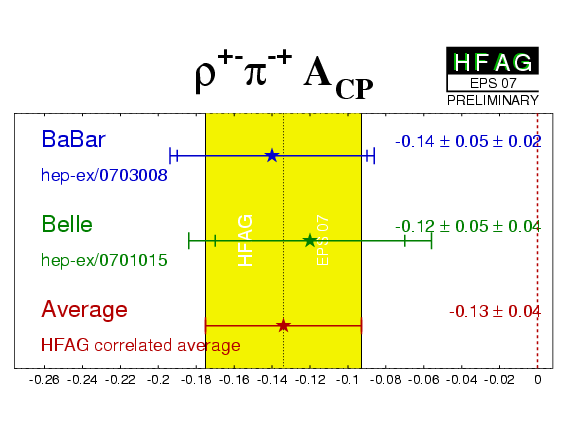
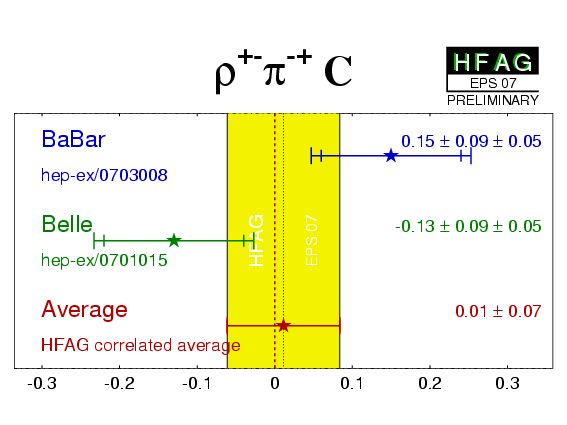
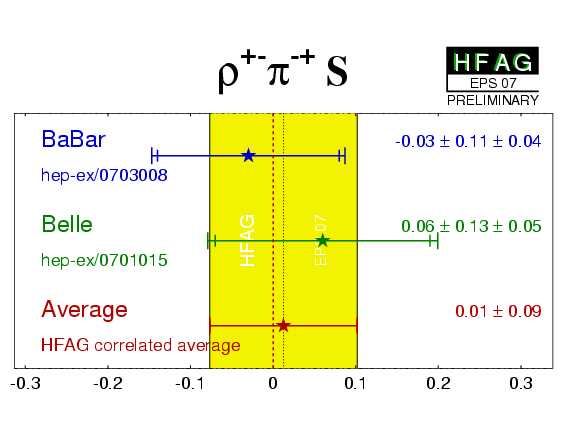
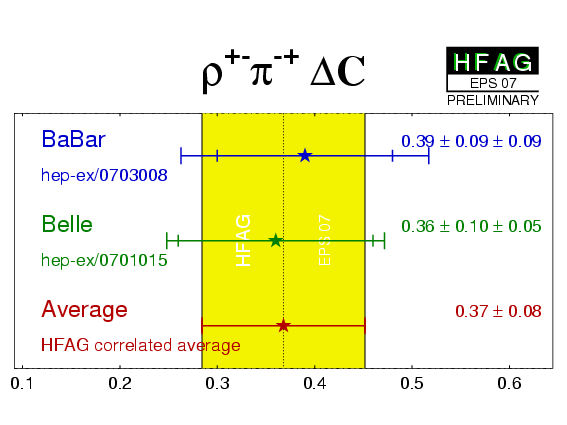
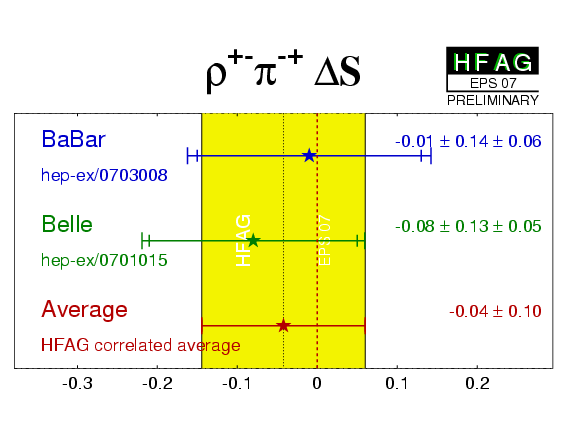
| Experiment | ACP (ρ+−π−+) | C (ρ+−π−+) | S (ρ+−π−+) | ΔC (ρ+−π−+) | ΔS (ρ+−π−+) | Correlations | Reference |
|---|---|---|---|---|---|---|---|
|
BaBar
N(BB)=375M |
−0.14 ± 0.05 ± 0.02 | 0.15 ± 0.09 ± 0.05 | −0.03 ± 0.11 ± 0.04 | 0.39 ± 0.09 ± 0.09 | −0.01 ± 0.14 ± 0.06 | (stat) | PRD 76 (2007) 012004 |
|
Belle
N(BB)=449M |
−0.12 ± 0.05 ± 0.04 | −0.13 ± 0.09 ± 0.05 | 0.06 ± 0.13 ± 0.05 | 0.36 ± 0.10 ± 0.05 | −0.08 ± 0.13 ± 0.05 | (stat) | PRL 98 (2007) 221602 |
| Average | −0.13 ± 0.04 | 0.01 ± 0.07 | 0.01 ± 0.09 | 0.37 ± 0.08 | −0.04 ± 0.10 | (stat) |
HFAG correlated average
χ2 = 4.2/5 dof (CL=0.52 ⇒ 0.6σ) |
|
|
eps.gz png |
eps.gz png |
eps.gz png |
eps.gz png |
eps.gz png |
. | |
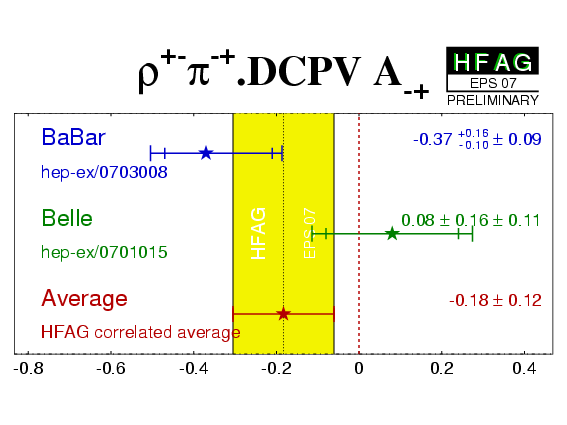
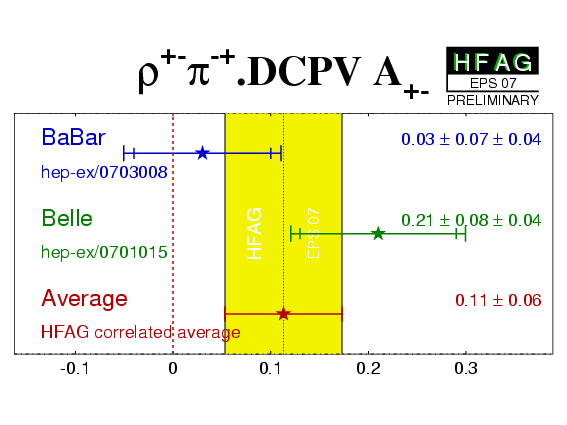
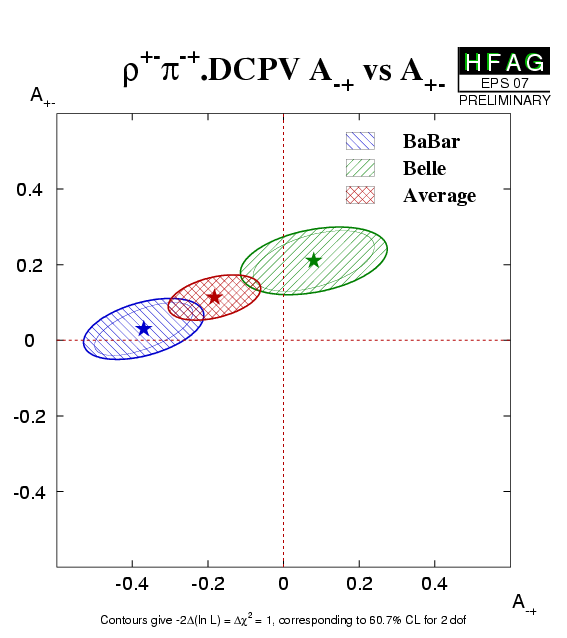
| Experiment | A−+ (ρ+−π−+) | A+− (ρ+−π−+) | Correlation | Reference |
|---|---|---|---|---|
|
BaBar
N(BB)=375M |
−0.37 +0.16 −0.10 ± 0.09 | 0.03 ± 0.07 ± 0.04 | 0.62 | PRD 76 (2007) 012004 |
|
Belle
N(BB)=449M |
0.08 ± 0.16 ± 0.11 | 0.21 ± 0.08 ± 0.04 | 0.47 | PRL 98 (2007) 221602 |
| Average | −0.18 ± 0.12 | 0.11 ± 0.06 | 0.40 |
HFAG correlated average
χ2 = 4.0/2 dof (CL=0.14 ⇒ 1.5σ) |
|
|
eps.gz png |
eps.gz png |
eps.gz png |
|
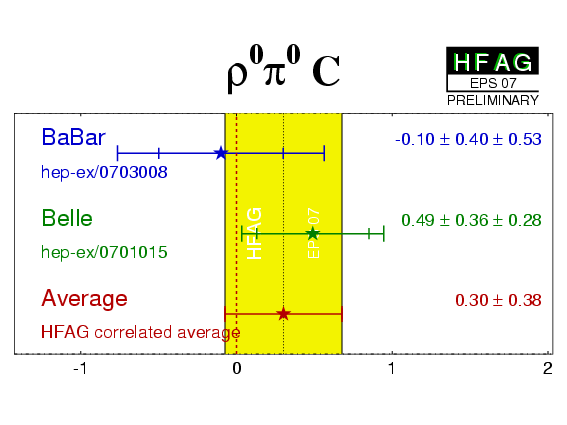
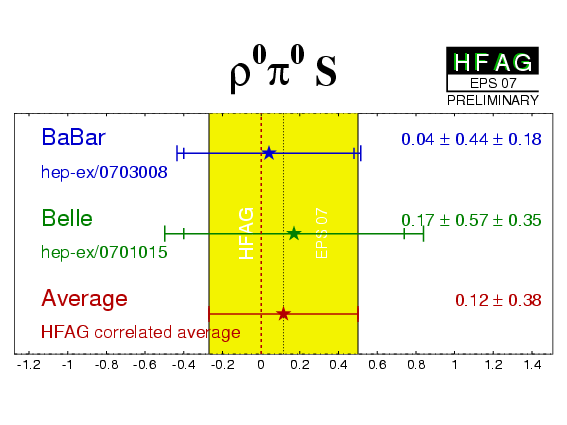
| Experiment | C (ρ0π0) | S (ρ0π0) | Correlation | Reference |
|---|---|---|---|---|
|
BaBar
N(BB)=375M |
−0.10 ± 0.40 ± 0.53 | 0.04 ± 0.44 ± 0.18 | 0.35 | PRD 76 (2007) 012004 |
|
Belle
N(BB)=449M |
0.49 ± 0.36 ± 0.28 | 0.17 ± 0.57 ± 0.35 | 0.08 | PRL 98 (2007) 221602 |
| Average | 0.30 ± 0.38 | 0.12 ± 0.38 | 0.12 |
HFAG correlated average
χ2 = 0.5/2 dof (CL=0.76 ⇒ 0.3σ) |
|
|
eps.gz png |
eps.gz png |
eps.gz png |
|
Interpretations:
The information given above can be used to extract α ≡ φ2.
From the measured form factor bilinears,
BaBar
extract a confidence level interpretation for α,
and constrain α = (87+45−13)° at 68% confidence level.
Belle
has performed a similar analysis.
In addition, Belle
has also included information from the SU(2) partners of B → ρπ,
which can be used to constrain α ≡ φ2 via an
isospin pentagon
relation.
The isospin analysis uses as input the branching fractions and
CP-violating charge asymmetries
of all five ρπ decay modes
(ρ+π−,ρ−π+,
ρ0π0, ρ+π0,
ρ0π+).
The relevant information is taken from
HFAG - Rare Decays and is tabulated below.
[Branching fractions are given in units of 10−6.]
Those values that are not included in the table below
can be obtained from the bilinear form-factors,
eg. a measurement
BR(B0 → ρ0π0)/
BR(B0 → ρ+−π−+) = 0.133 ± 0.022 ± 0.023,
is extracted.
With all information in the ρπ channels put together,
Belle
obtain the tighter constraint
68° < φ2 < 95° at 68% confidence level,
for the solution consistent with the Standard Model.
| BR(B0 → ρ+−π−+) = 23.1 ± 2.7 | - |
| BR(B+ → ρ+π0) = 10.9 +1.4−1.5 | ACP(B+ → ρ+π0) = 0.02 ± 0.11 |
| BR(B+ → π+ρ0) = 8.7 +1.0−1.1 | ACP(B+ → π+ρ0) = −0.07 +0.12−0.13 |
NB. It is implied in the above constraints on α ≡ φ2 that a mirror solution at α → α + π ≡ φ2 → φ2 + π also exists.
For more details on the world average for α ≡ φ2, calculated with different statistical treatments, refer to the CKMfitter and UTfit pages.
The vector particles in the pseudoscalar to vector-vector decay Bd → ρ+ρ− can have longitudinal and transverse relative polarization with different CP properties. The decay is found to be dominated by the longitudinally polarized component:
At present we do not apply a rescaling of the results to a
common, updated set of input parameters.
The CP parameters measured are those for the longitudinally polarized component
(ie. Sρρ,long, Cρρ,long).
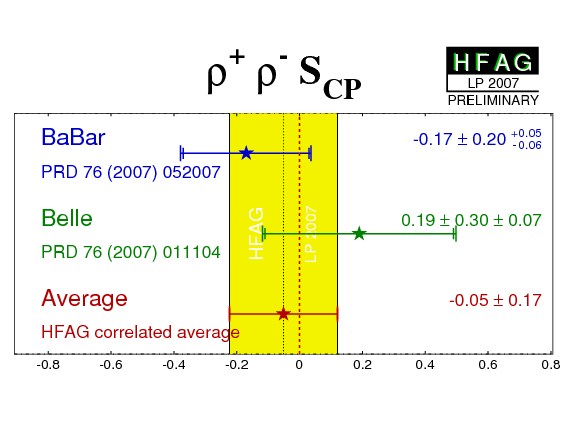
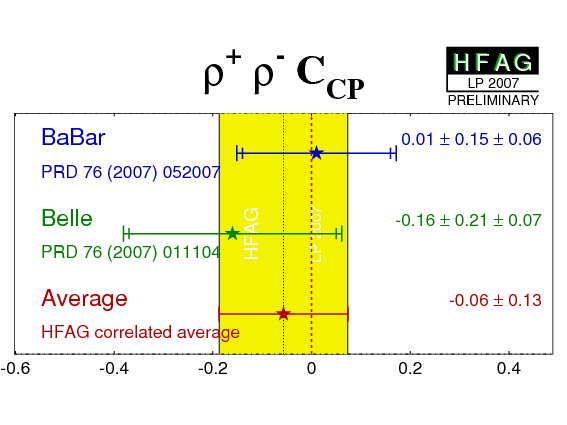
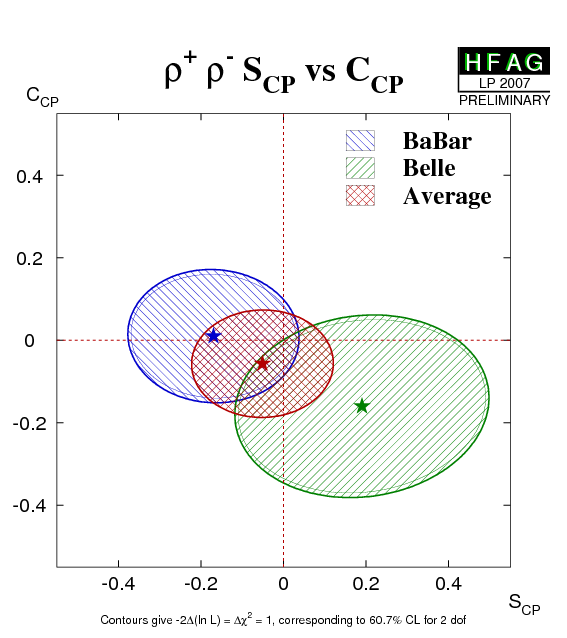
| Experiment | SCP (ρ+ρ−) | CCP (ρ+ρ−) | Correlation | Reference |
|---|---|---|---|---|
|
BaBar
N(BB)=387M |
−0.17 ± 0.20 +0.05 −0.06 | 0.01 ± 0.15 ± 0.06 | −0.04 (stat) | PRD 76 (2007) 052007 |
|
Belle
N(BB)=535M |
0.19 ± 0.30 ± 0.07 | −0.16 ± 0.21 ± 0.07 | 0.10 (stat) | PRD 76 (2007) 011104 |
| Average | −0.05 ± 0.17 | −0.06 ± 0.13 | 0.01 |
HFAG correlated average
χ2 = 1.4/2 dof (CL=0.50 ⇒ 0.7σ) |
|
|
eps.gz png |
eps.gz png |
eps.gz png |
|
Since the decay Bd → ρ0ρ0 results in an all charged particle final state, its time-dependent CP violation parameters can be determined experimentally, if difficulties related to the small branching fraction and large backgrounds can be overcome. BaBar have performed the first such analysis. They measure the longitudinally polarized component to be
At present we do not apply a rescaling of the results to a
common, updated set of input parameters.
The CP parameters measured are those for the longitudinally polarized component
(ie. Sρρ,long, Cρρ,long).
| Experiment | SCP (ρ0ρ0) | CCP (ρ0ρ0) | Correlation | Reference |
|---|---|---|---|---|
|
BaBar
N(BB)=427M |
0.5 ± 0.9 ± 0.2 | 0.4 ± 0.9 ± 0.2 | - | arXiv:0708.1630 |
Interpretations:
The
Gronau-London
isospin analysis allows a constraint on α ≡ φ2
to be extracted from the ρρ system even in the presence of non-negligible
penguin contributions.
The analysis involves the SU(2) partners of
the Bd→ ρ+ρ− decay.
The relevant branching ratios (given in units of 10−6)
and CP-violating charge asymmetries are taken from
HFAG - Rare Decays.
| BR(B0 → ρ+ρ−) = 24.2 +3.1−3.2 | - |
| BR(B+ → ρ+ρ0) = 18.2 ± 3.0 | ACP(B+ → ρ+ρ0) = −0.08 ± 0.13 |
| BR(B0 → ρ0ρ0) = 1.1 ± 0.4 | ACP(B0 → ρ0ρ0) NOT MEASURED YET |
Belle
obtain φ2 = (88 ± 17)° or
59° < φ2 < 117° at 90% confidence level.
BaBar
find α ∈ [73, 117]° at 68% confidence level.
In the BaBar analysis of
Bd → ρ0ρ0,
a constraint of |α - αeff| < 14.5° (16.5°)
is obtained at the 68% (90%) CL.
The solution at α - αeff = +11.3° is preferred.
NB. It is implied in the above constraints on α ≡ φ2 that a mirror solution at α → α + π ≡ φ2 → φ2 + π also exists.
For more details on the world average for α ≡ φ2, calculated with different statistical treatments, refer to the CKMfitter and UTfit pages.
The BaBar collaboration have performed a Q2B analysis of the Bd → a1+−π−+ decay, reconstructed in the final state π+π−π+π−.
| Experiment | ACP (a1+−π−+) | C (a1+−π−+) | S (a1+−π−+) | ΔC (a1+−π−+) | ΔS (a1+−π−+) | Correlations | Reference |
|---|---|---|---|---|---|---|---|
|
BaBar
N(BB)=384M |
−0.07 ± 0.07 ± 0.02 | −0.10 ± 0.15 ± 0.09 | 0.37 ± 0.21 ± 0.07 | 0.26 ± 0.15 ± 0.07 | −0.14 ± 0.21 ± 0.06 | (stat) | PRL 98 (2007) 181803 |
| Experiment | A−+ (a1+−π−+) | A+− (a1+−π−+) | Correlation | Reference |
|---|---|---|---|---|
|
BaBar
N(BB)=384M |
0.07 ± 0.21 ± 0.15 | 0.15 ± 0.15 ± 0.07 | 0.63 | PRL 98 (2007) 181803 |
Interpretations:
The parameter αeff ≡ φ2,eff,
which reduces to α ≡ φ2 in the limit of
no penguin contributions, can be extracted from the above results.
BaBar obtain αeff = (78.6 ± 7.3)°
NB. There is a four-fold ambiguity in the above result.
For more details on the world average for α ≡ φ2, calculated with different statistical treatments, refer to the CKMfitter and UTfit pages.
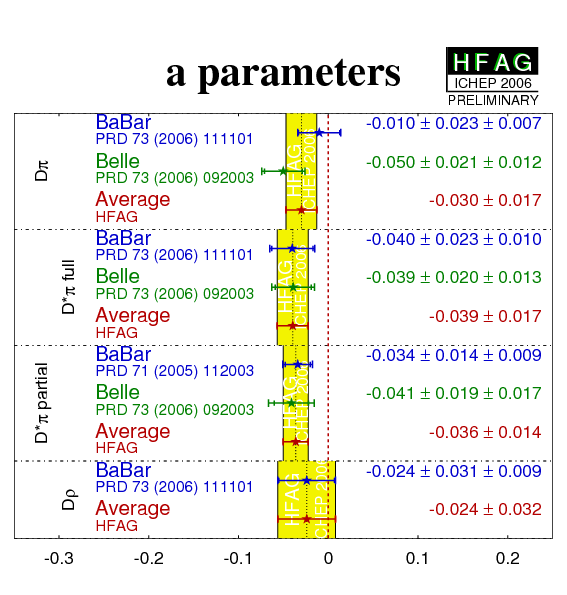
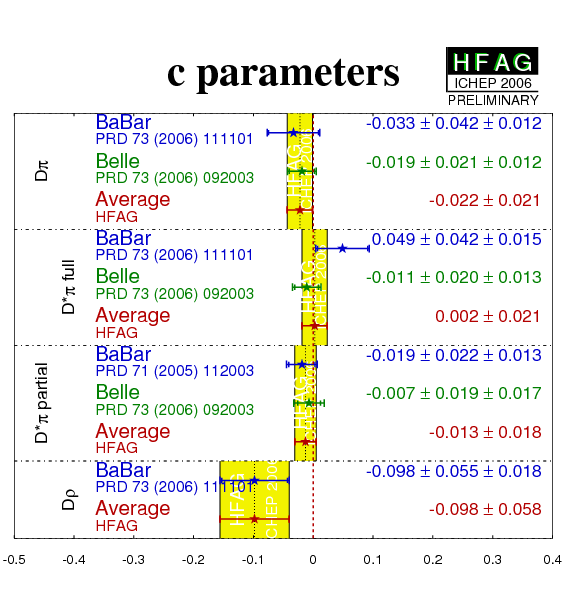
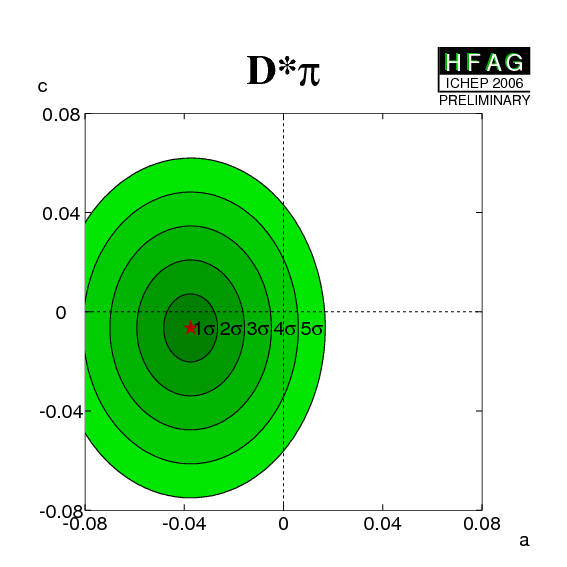
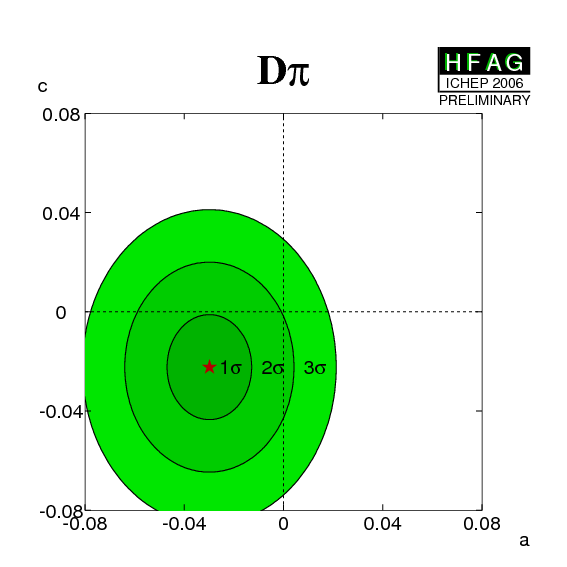
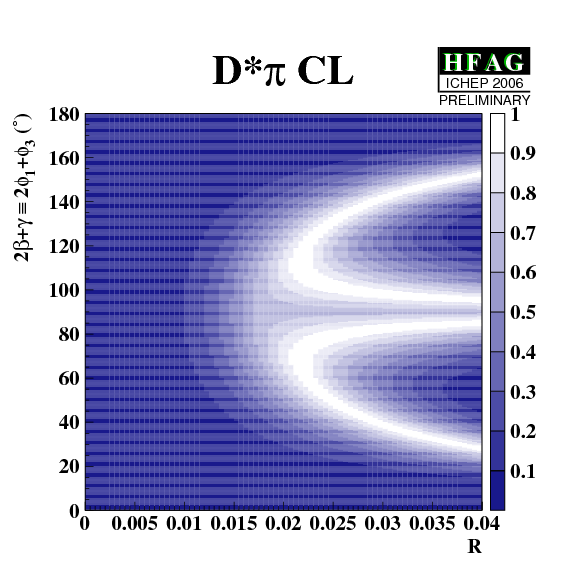
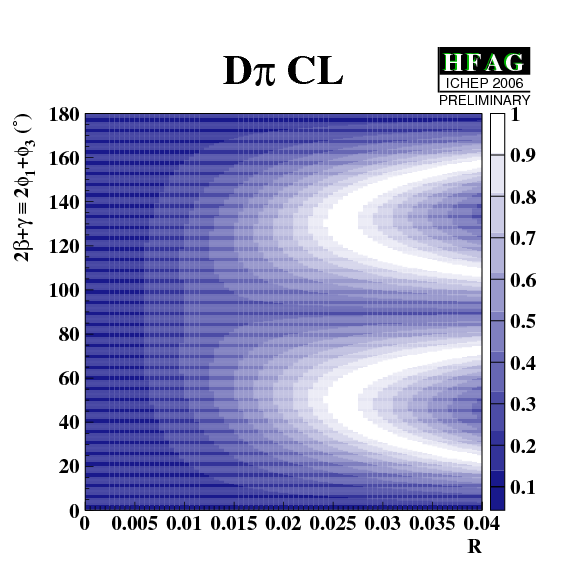
Neutral B meson decays such as Bd → D+−π−+, Bd → D*+−π−+ and Bd → D+−ρ−+ provide sensitivity to γ ≡ φ3 because of the interference between the Cabibbo-favoured amplitude (e.g. B0 → D−π+) with the doubly Cabibbo-suppressed amplitude (e.g. B0 → D+π−). The relative weak phase between these two amplitudes is −γ ≡ −φ3 and, when combined with the BdBd-bar mixing phase, the total phase difference is −(2β+γ) ≡ −(2φ1+φ3).
The size of the CP violating effect in each mode depends on the ratio of magnitudes of the suppressed and favoured amplitudes, e.g., rDπ = |A(B0 → D+π−)/A(B0 → D−π+)|. Each of the ratios rDπ, rD*π and rDρ is expected to be about 0.02, and can be obtained experimentally from the corresponding suppressed charged B decays, (e.g., B+ → D+π0) using isospin, or from self-tagging decays with strangeness (e.g., B0 → Ds+π−), using SU(3). In the latter case, the theoretical uncertainties are hard to quantify. The smallness of the r values makes direct extractions from, e.g., the D+−π−+ system very difficult.
Both BABAR and Belle exploit partial reconstructions of D*+−π−+ to increase the available statistics. Both experiments also reconstruct D+−π−+ and D*+−π−+ fully, and BABAR includes the mode D+−ρ−+. Additional states with similar quark content are also possible, but for vector-vector final states an angular analysis is required, while states containing higher resonances may suffer from uncertainties due to nonresonant or other contributions.
BABAR and Belle use different observables:
Here we convert the Belle results to express them in terms of a and c. Explicitly, the conversion reads:
| Belle D*π (partial reconstruction): | aπ* = − (S+ + S−)/2 |
| cπ* = − (S+ − S−)/2 | |
| Belle D*π (full reconstruction): | aπ* = + ( 2 RD*π sin( 2φ1+φ3 + δD*π ) + 2 RD*π sin( 2φ1+φ3 − δD*π ) )/2 |
| cπ* = + ( 2 RD*π sin( 2φ1+φ3 + δD*π ) − 2 RD*π sin( 2φ1+φ3 − δD*π ) )/2 | |
| Belle Dπ (full reconstruction): | aπ = − ( 2 RDπ sin( 2φ1+φ3 + δDπ ) + 2 RDπ sin( 2φ1+φ3 − δDπ ) )/2 |
| cπ = − ( 2 RDπ sin( 2φ1+φ3 + δDπ ) − 2 RDπ sin( 2φ1+φ3 − δDπ ) )/2 |
At present we do not rescale the results to a common set of input parameters. Also, common systematic errors are not considered.
| Observable | BABAR | Belle | Average | Reference | ||
|---|---|---|---|---|---|---|
|
partially reconstructed N(BB)=232m |
fully reconstructed N(BB)=232m |
partially reconstructed N(BB)=386m |
fully reconstructed N(BB)=386m |
|||
| aD*π | −0.034 ± 0.014 ± 0.009 | −0.040 ± 0.023 ± 0.010 | −0.041 ± 0.019 ± 0.017 | −0.039 ± 0.020 ± 0.013 | −0.037 ± 0.011
CL=0.96 (0.0σ) |
BaBar: PRD 71 (2005) 112003 (partially reco.) BaBar: PRD 73 (2006) 111101 (fully reco.) Belle: PRD 73, 092003 (2006) |
| - | COMBINED: −0.040 ± 0.014 ± 0.011 | |||||
| cD*π | −0.019 ± 0.022 ± 0.013
(lepton tags only) |
0.049 ± 0.042 ± 0.015
(lepton tags only) |
−0.007 ± 0.019 ± 0.017 | −0.011 ± 0.020 ± 0.013 | −0.006 ± 0.014 CL=0.41 (0.8σ) |
|
| - | COMBINED: −0.009 ± 0.014 ± 0.011 | |||||
| aDπ | - | −0.010 ± 0.023 ± 0.007 | - | −0.050 ± 0.021 ± 0.012 | −0.030 ± 0.017
CL=0.24 (1.2σ) |
|
| cDπ | - | −0.033 ± 0.042 ± 0.012
(lepton tags only) |
- | −0.019 ± 0.021 ± 0.012 | −0.022 ± 0.021
CL=0.78 (0.3σ) |
|
| aDρ | - | −0.024 ± 0.031 ± 0.009 | - | - | −0.024 ± 0.033 | |
| cDρ | - | −0.098 ± 0.055 ± 0.018
(lepton tags only) |
- | - | −0.098 ± 0.058 | |
| Compilation of the above results. |
eps.gz png |
eps.gz png |
| Averages of the D*π results. |
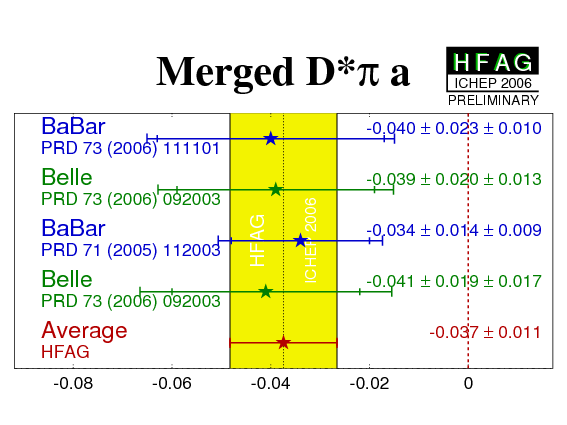
eps.gz png |
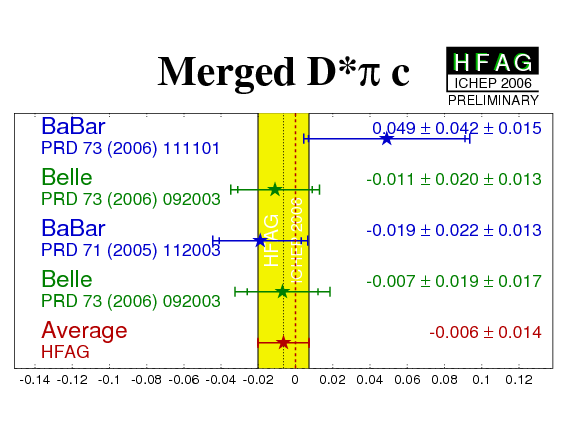
eps.gz png |
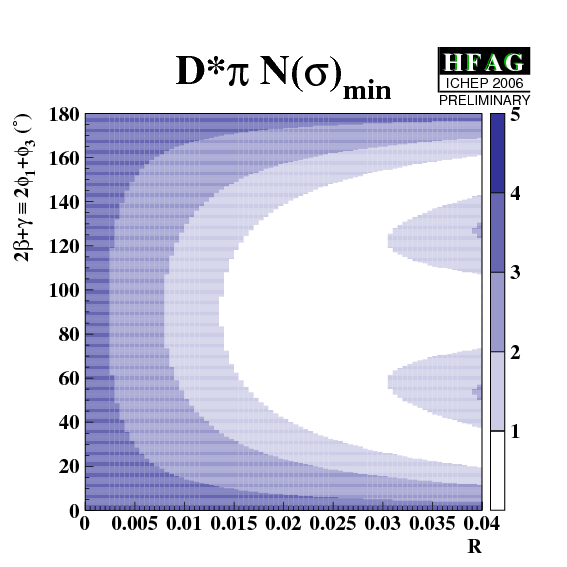
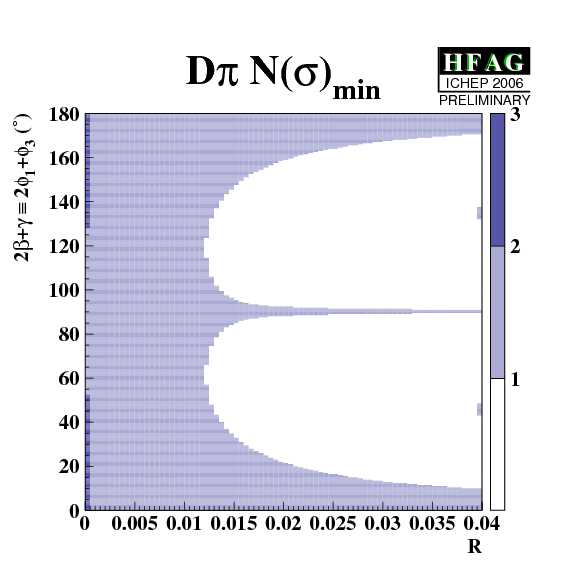
Digression:
|
Constraining 2β+γ ≡
2φ1+φ3:
The constraints can be tightened if one is willing to use theoretical input on the values of R and/or δ. One popular choice is the use of SU(3) symmetry to obtain R by relating the suppressed decay mode to B decays involving Ds mesons. For more information, visit the CKMfitter and UTfit sites. |
eps.gz png |
eps.gz png CL: eps.gz png |
eps.gz png |
eps.gz png CL: eps.gz png |
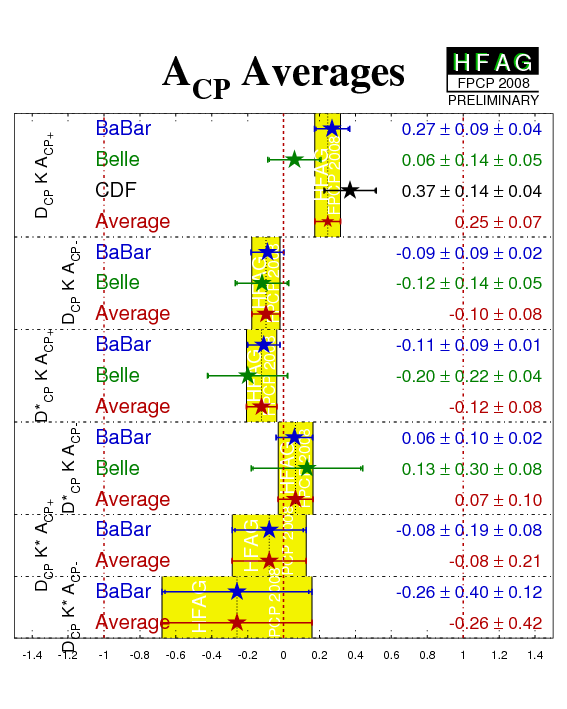
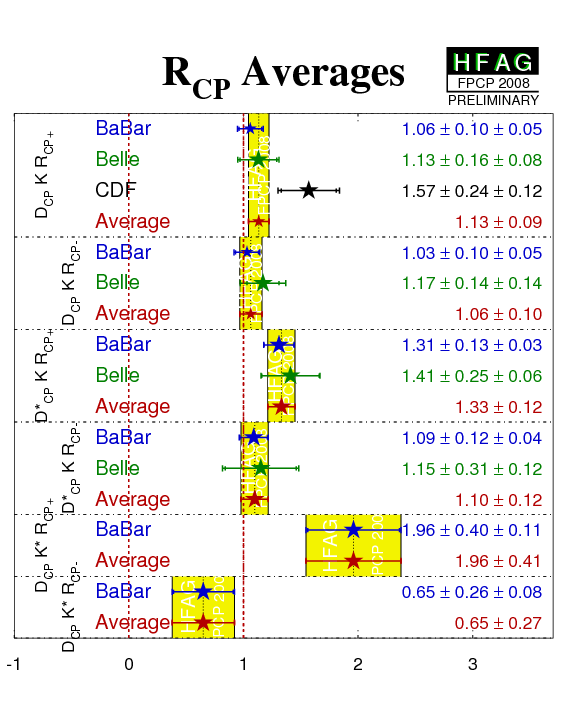
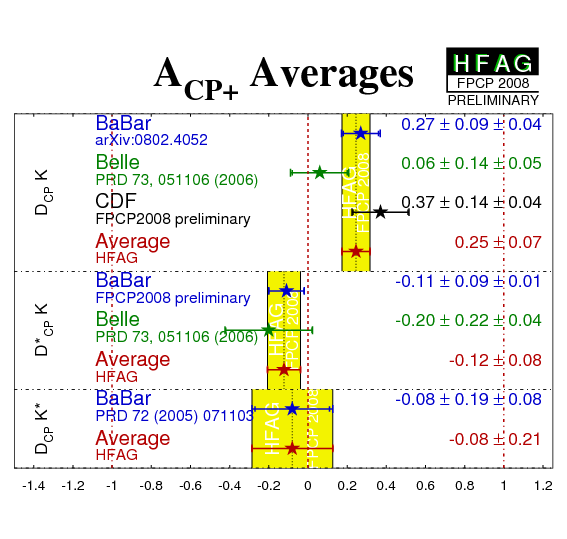
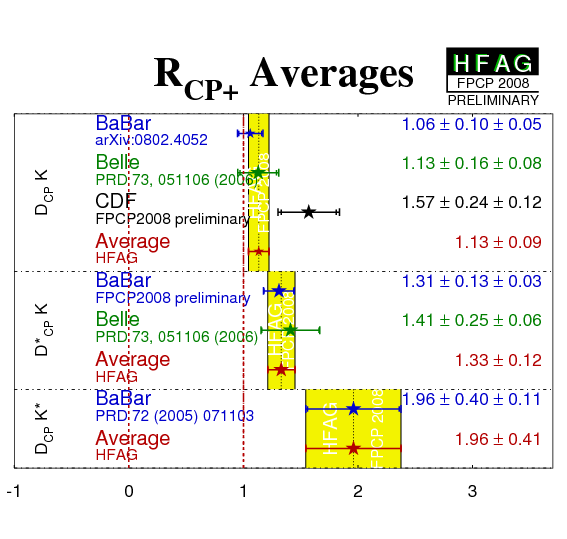
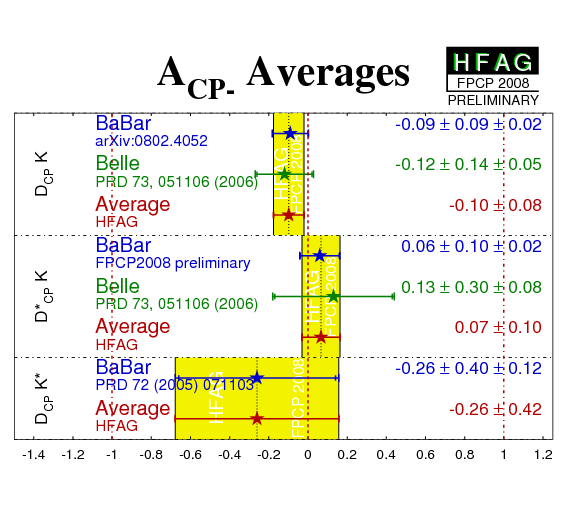
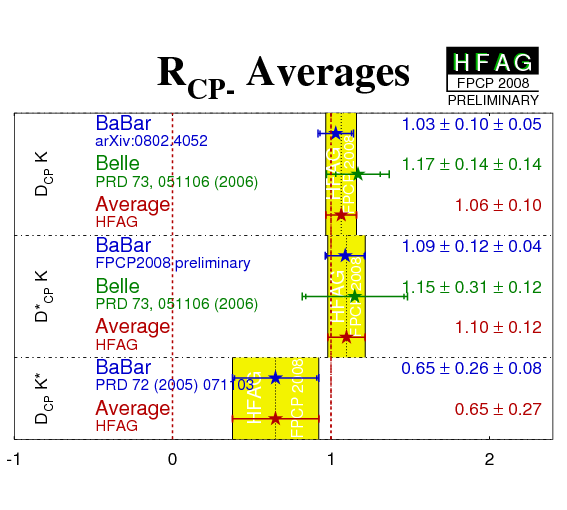
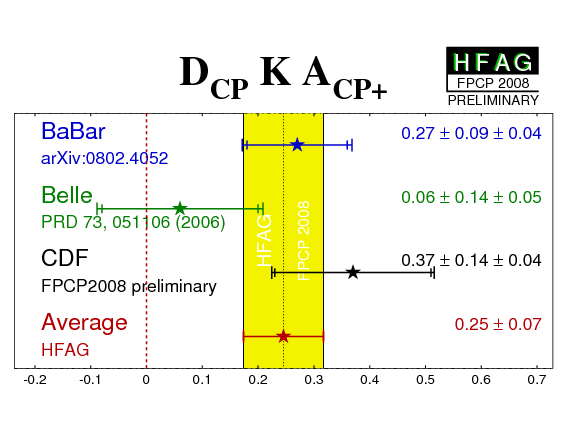
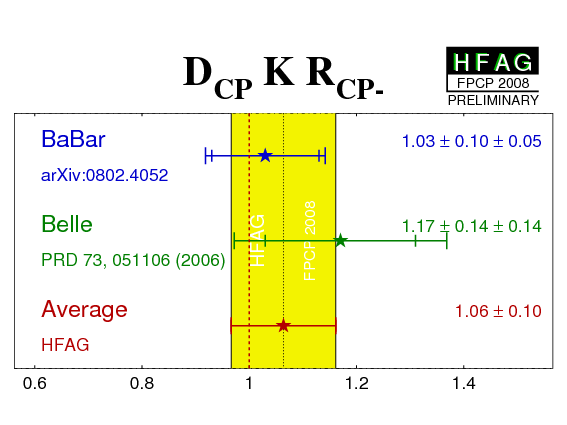
A theoretically clean measurement of the angle γ ≡ φ3 can be obtained from the rate and asymmetry measurements of B− → D(*)CPK(*)− decays, where the D(*) meson decays to CP even (D(*)CP+) and CP odd (D(*)CP−) eigenstates. The method benefits from the interference between the dominant b→cu-bar s transitions with the corresponding doubly CKM-suppressed b→uc-bar s transition. It was proposed by Gronau, Wyler and Gronau, London (GLW).
BABAR, Belle and CDF use consistent definitions for ACP+− and RCP+−, where
| ACP+− = [Γ(B− → D(*)CP+−K(*)−) − Γ(B+ → D(*)CP+−K(*)+)] / Sum , |
| RCP+− = [Γ(B− → D(*)CP+−K(*)−) + Γ(B+ → D(*)CP+−K(*)+)] / [Γ(B− → D(*)0 K(*)−) + Γ(B+ → D(*)0-bar K(*)+)]. |
Experimentally, it is convenient to measure RCP+− using double ratios, in which similar ratios for B− → D(*) π(*)− decays are used for normalization.
These observables have been measured so far for three D(*)K(*)− modes.
At present we do not rescale the results to a common set of input parameters. Also, common systematic errors are not considered.
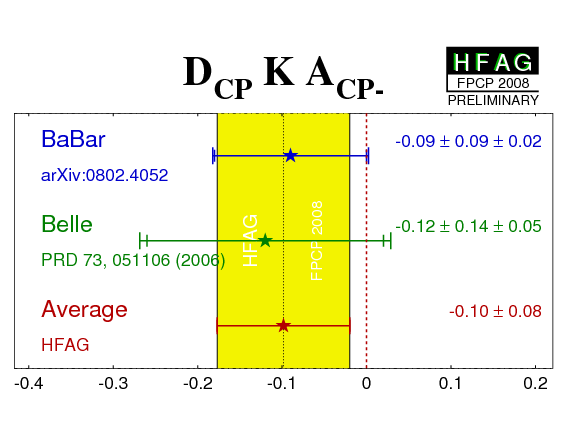
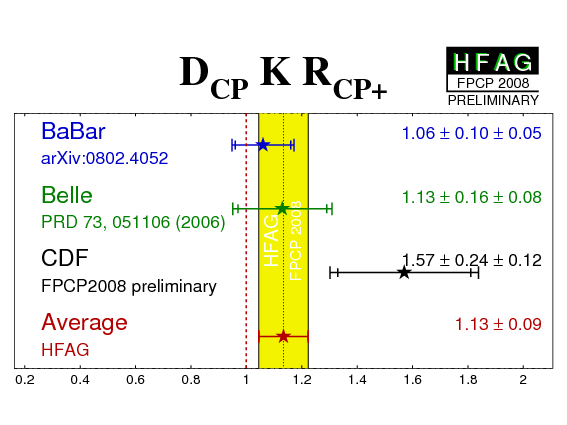
| Mode | Experiment | ACP+ | ACP− | RCP+ | RCP− | Reference |
|---|---|---|---|---|---|---|
| DCPK− |
BaBar
N(BB)=382M |
0.27 ± 0.09 ± 0.04 | −0.09 ± 0.09 ± 0.02 | 1.06 ± 0.10 ± 0.05 | 1.03 ± 0.10 ± 0.05 | arXiv:0802.4052 |
|
Belle
N(BB)=275M |
0.06 ± 0.14 ± 0.05 | −0.12 ± 0.14 ± 0.05 | 1.13 ± 0.16 ± 0.08 | 1.17 ± 0.14 ± 0.14 | PRD 73, 051106 (2006) | |
| CDF | 0.37 ± 0.14 ± 0.04 | - | 1.57 ± 0.24 ± 0.12 | - | FPCP2008 preliminary | |
| Average |
0.25 ± 0.07
χ2/ndf = 2.4/2 (CL=0.31 ⇒ 1.0σ) |
−0.10 ± 0.08
χ2 = 0.03 (CL=0.86 ⇒ 0.2σ) |
1.13 ± 0.09
χ2/ndf = 3.1/2 (CL=0.21 ⇒ 1.2σ) |
1.06 ± 0.10
χ2 = 0.4 (CL=0.54 ⇒ 0.6σ) |
HFAG | |
|
|
eps.gz png | eps.gz png | eps.gz png | eps.gz png | . | |
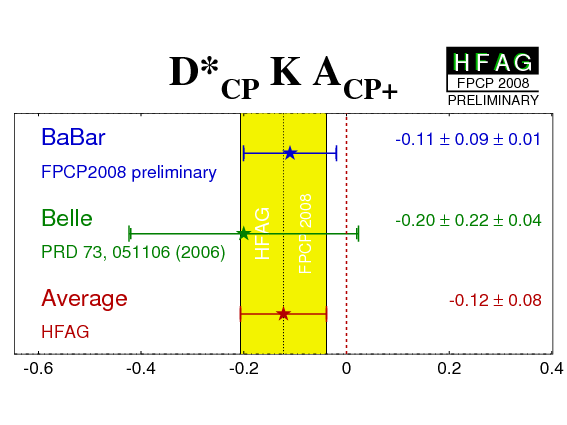
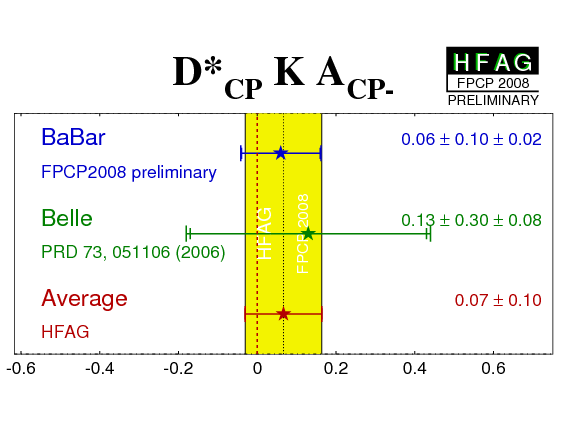
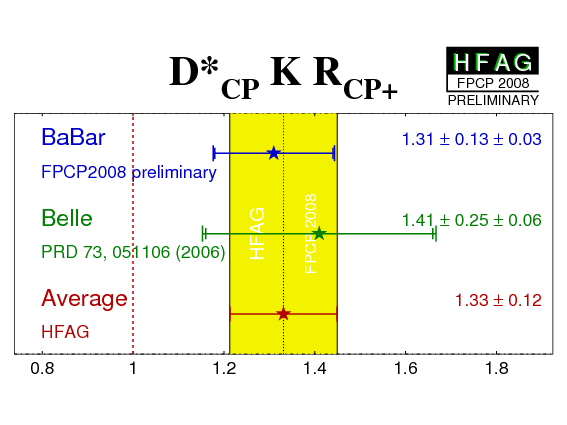
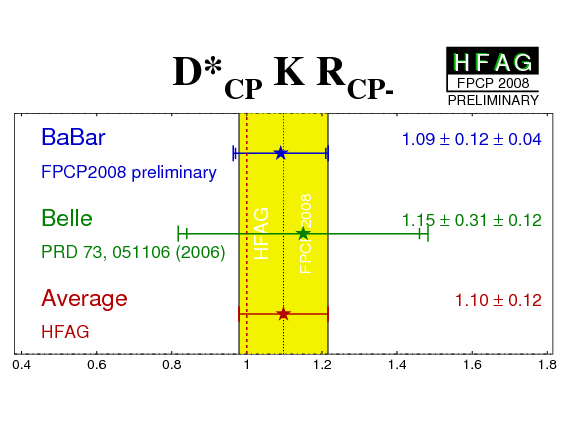
| D*CPK− |
BaBar
N(BB)=383M |
−0.11 ± 0.09 ± 0.01 | 0.06 ± 0.10 ± 0.02 | 1.31 ± 0.13 ± 0.03 | 1.09 ± 0.12 ± 0.04 | FPCP2008 preliminary |
|
Belle
N(BB)=275M |
−0.20 ± 0.22 ± 0.04 | 0.13 ± 0.30 ± 0.08 | 1.41 ± 0.25 ± 0.06 | 1.15 ± 0.31 ± 0.12 | PRD 73, 051106 (2006) | |
| Average |
−0.12 ± 0.08
χ2 = 0.14 (CL=0.71 ⇒ 0.4σ) |
0.07 ± 0.10
χ2 = 0.05 (CL=0.83 ⇒ 0.2σ) |
1.33 ± 0.12
χ2 = 0.12 (CL=0.73 ⇒ 0.4σ) |
1.10 ± 0.12
χ2 = 0.03 (CL=0.87 ⇒ 0.2σ) |
HFAG | |
|
|
eps.gz png | eps.gz png | eps.gz png | eps.gz png | . | |
| DCPK*− |
BaBar
N(BB)=232M |
−0.08 ± 0.19 ± 0.08 | −0.26 ± 0.40 ± 0.12 | 1.96 ± 0.40 ± 0.11 | 0.65 ± 0.26 ± 0.08 | PRD 72 (2005) 071103 |
| Belle | NO RESULTS AVAILABLE (*) | - | ||||
| Average | −0.08 ± 0.21 | −0.26 ± 0.42 | 1.96 ± 0.41 | 0.65 ± 0.27 | HFAG | |
| Compilation of the above results. |
eps.gz png |
eps.gz png |
| CP+ only |
eps.gz png |
eps.gz png |
| CP- only |
eps.gz png |
eps.gz png |
Digression:
Constraining γ ≡ φ3:
The rate ratios and asymmetries of the GLW method can be
expressed in terms of amplitude ratios and strong phase differences,
as well as the weak phase difference γ ≡ φ3.
For the GLW observables, one has:
where rB = |A(b→u)/A(b→c)| and δB = arg[A(b→u)/A(b→c)]. Only the weak phase difference γ ≡ φ3 is universal, while the other parameters depend on the decay process. In addition, the Cartesian coordinates x± (discussed below in the context of analysis of B→DK with multibody D decay) can be extracted from the observables measured in GLW analysis. The relations are
There is no direct sensitivity to y+−, but indirect bounds can be obtained using
|
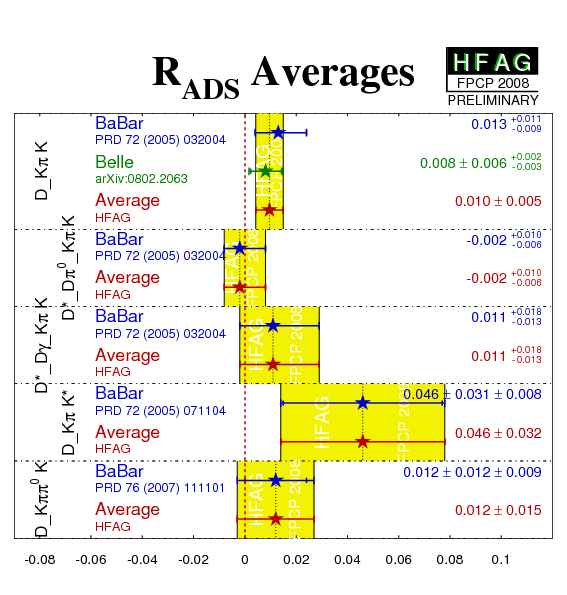
A modification of the GLW idea has been suggested by Atwood, Dunietz and Soni, where B− → DK− with D → K+π− (or similar) and the charge conjugate decays are used. Here, the favoured (b→c) B decay followed by the doubly CKM-suppressed D decay interferes with the suppressed (b→u) B decay followed by the CKM-favored D decay. The relative similarity of the combined decay amplitudes enhances the possible CP asymmetry. BABAR and Belle use consistent definitions for AADS and RADS, where (for example for the B− → DK−, D → K+π− mode)
| AADS = [Γ(B− → [K+π−]DK−) − Γ(B+ → [K−π+]DK+)] / [Γ(B− → [K+π−]DK−) + Γ(B+ → [K−π+]DK+)] , |
| RADS = [Γ(B− → [K+π−]DK−) + Γ(B+ → [K−π+]DK+)] / [Γ(B− → [K−π+]DK−) + Γ(B+ → [K+π−]DK+)] . |
(Some of) these observables have been measured so far for the D(*)K− modes. Belle have presented results for B− → DK− while BaBar have also presented results using B− → D*K−, with both D* → Dπ0 and D* → Dγ, and B− → DK*−. For all the above the D → K+π− mode is used. In addition, BaBar have presented preliminary results using B− → DK− with D → K+π−π0.
At present we do not rescale the results to a common set of input parameters. Also, common systematic errors are not considered.
| Mode | Experiment | RADS | AADS | Reference |
|---|---|---|---|---|
|
DK−
D→Kπ |
BaBar
N(BB)=232M |
0.013 +0.011 −0.009 | - | PRD 72 (2005) 032004 |
|
Belle
N(BB)=657M |
0.008 ± 0.006 +0.002 −0.003 | −0.13 +0.97 −0.88 ± 0.26 | arXiv:0804.2063 | |
| Average |
0.010 ± 0.005
χ2 = 0.19 (CL=0.67 ⇒ 0.4σ) |
−0.13 +1.00 −0.92 | HFAG | |
|
D*K−
D* → Dπ0 D→Kπ |
BaBar
N(BB)=232M |
−0.002+0.010 −0.006 | - | PRD 72 (2005) 032004 |
| Average | −0.002+0.010 −0.006 | - | HFAG | |
|
D*K−
D* → Dγ D→Kπ |
BaBar
N(BB)=232M |
0.011+0.018 −0.013 | - | PRD 72 (2005) 032004 |
| Average | 0.011+0.018 −0.013 | - | HFAG | |
|
DK*−
D→Kπ |
BaBar
N(BB)=232M |
0.046 ± 0.031 ± 0.008 | −0.22 ± 0.61 ± 0.17 | PRD 72 (2005) 071104 |
| Average | 0.046 ± 0.032 | −0.22 ± 0.63 | HFAG | |
|
DK−
D→Kππ0 |
BaBar
N(BB)=226M |
0.012 ± 0.012 ± 0.009 | - | PRD 76 (2007) 111101 |
| Average | 0.012 ± 0.015 | - | HFAG | |
| Compilation of the above results. |
eps.gz png |
Digression:
|
Constraining γ ≡ φ3: As for the GLW method, the rate ratios and asymmetries of the ADS method can be expressed in terms of amplitude ratios and strong phase differences, as well as the weak phase difference γ ≡ φ3. For the ADS observables, one has:
where rB = |A(b→u)/A(b→c)| and δB = arg[A(b→u)/A(b→c)] as before. rD and δD are the corresponding amplitude ratio and strong phase difference of the D meson decay amplitudes. The value of rD2 is obtained from the ratio of the suppressed-to-allowed branching fractions BR(D0 → K+π−) = (1.43 ± 0.04)×10−4 and BR(D0 → K−π+) = (3.80 ± 0.07)×10−2 [PDG 2006], respectively. With this it is found rD = 0.0613 ± 0.0010. The strong phase, δB, is different, in general, for decays to D and D* mesons. Bondar and Gershon have pointed out that there is an effective strong phase shift of π between the cases that D* is reconstructed in the Dπ0 and Dγ final states, which in principle allows γ ≡ φ3 to be measured using the ADS technique with B+− → D* K+− alone. The situation for D→Kππ0 is slightly more complicated since the hadronic parameters can vary across the phase space (Dalitz plane). Effective hadronic parameters can be used, and eventually a Dalitz analysis (either binned or unbinned) may be possible to extract the maximum information from the decay. |
As can be seen from the expressions above, the maximum size of the asymmetry, for given values of rB and rD is given by: AADS (max) = 2rBrD / (rB2+rD2). Thus, sizeable asymmetries may be found also for B− → D(*)π− decays, despite the expected smallness (~0.01) of rB for this case, providing sensitivity to γ ≡ φ3. The observables have been measured by Belle in the Dπ− mode.
| Mode | Experiment | RADS | AADS | Reference |
|---|---|---|---|---|
|
Dπ−
D→Kπ |
Belle
N(BB)=657M |
0.0034 +0.0006 −0.0005 +0.0001 −0.0002 | −0.023 ± 0.218 ± 0.071 | arXiv:0804.2063 |
| Average | 0.0034 ± 0.0006 | −0.023 ± 0.229 |
An update of these averages to include new results from the Winter 2008 conferences (Moriond 2008 (Italy), FPCP2008 (Taiwan) etc.) is in progress. Contact us if you require further information.
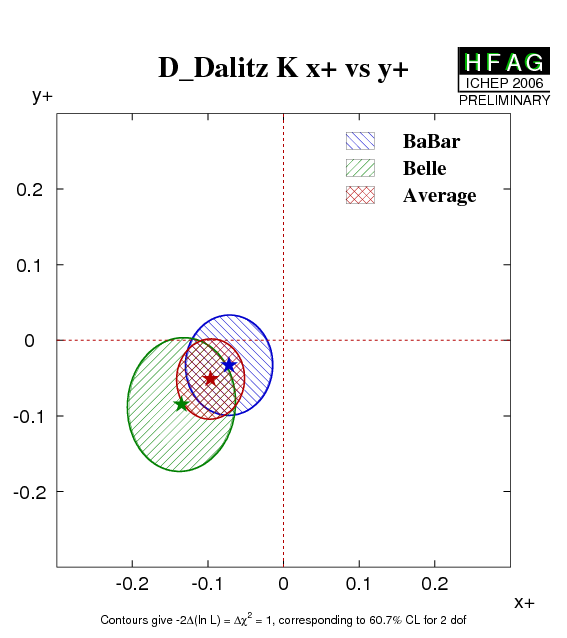
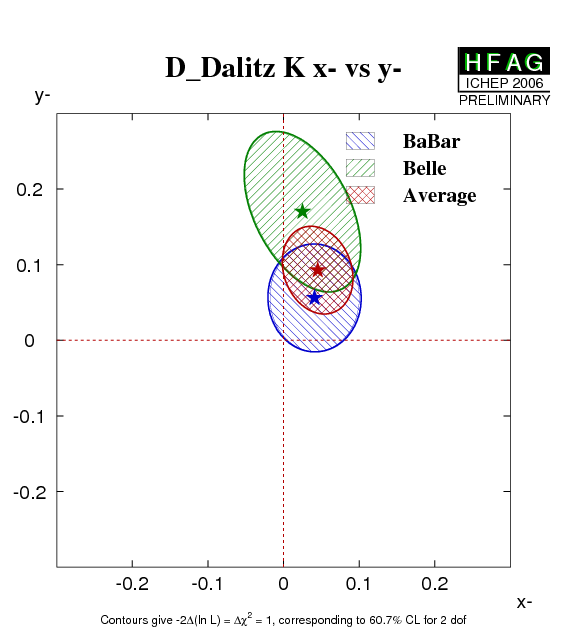
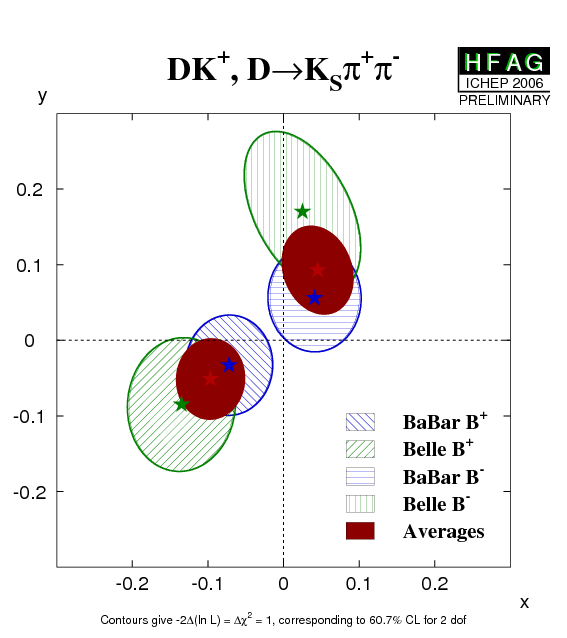
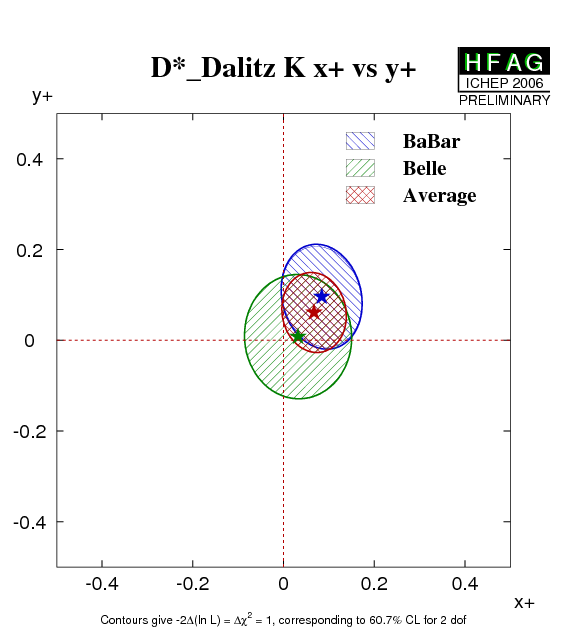
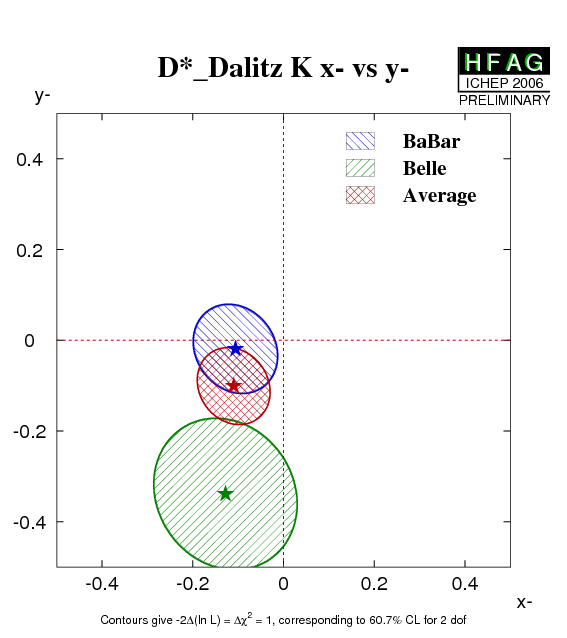
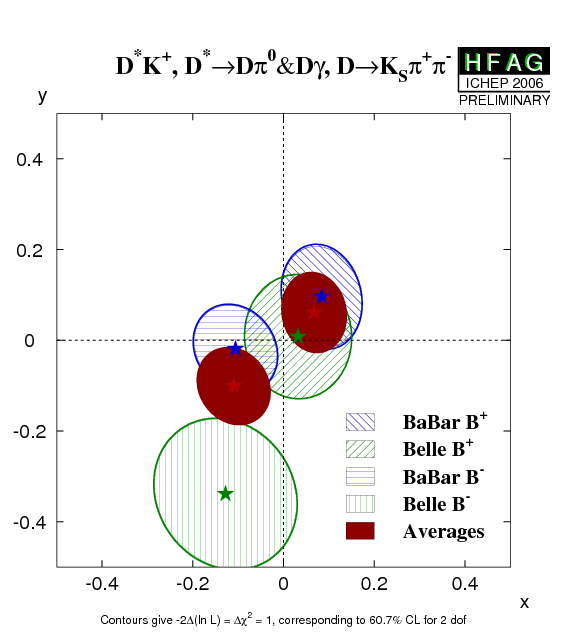
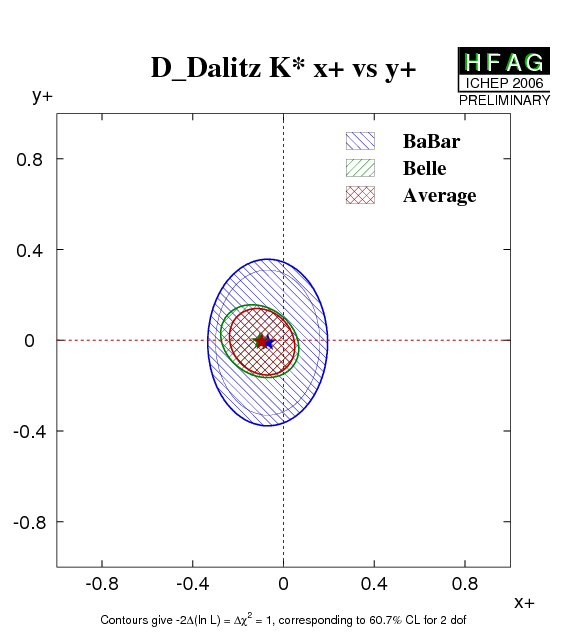
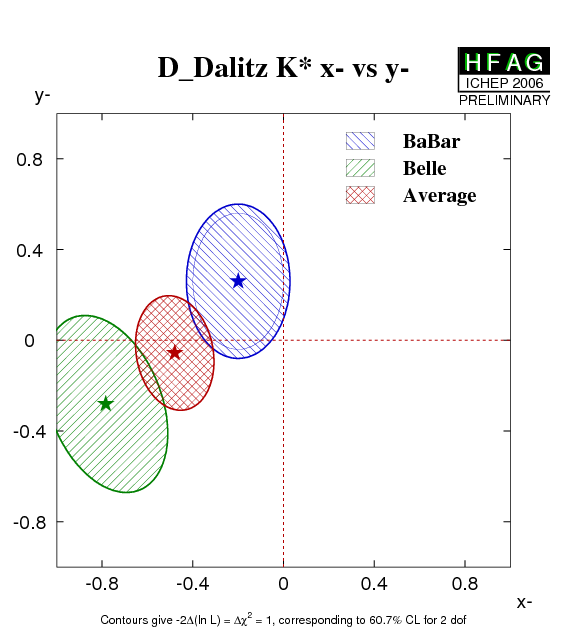
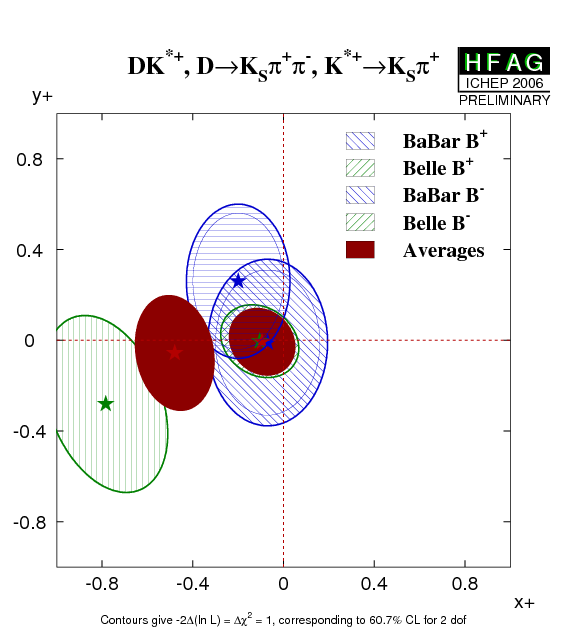
Another method to extract γ ≡ φ3 from the interference between B− → D(*)0 K− and B− → D(*)0-bar K− uses multibody D decays. A Dalitz plot analysis allows simultaneous determination of the weak phase difference γ ≡ φ3, the strong phase difference δB and the ratio of amplitudes rB. This idea was proposed by Giri, Grossman, Soffer and Zupan and the Belle Collaboration. The assumption of a D decay model results in an additional model uncertainty.
Results are available from both Belle and BaBar using B− → D K−, B− → D*K− and B− → DK*−. Belle use the D* decay to Dπ0 only, while BaBar also use Dγ, and take the effective strong phase shift into account. In all cases the decay D → KSπ+π− is used.
For the DK*− mode, both collaborations use K*− → KSπ−; in this case some care is needed due to other possible contributions to the B− → DKSπ− final state. Belle assign an additional (model) uncertainty, while BaBar use an alternative parametrization [replacing rB and δB with κrs and δs, respectively] suggested by Gronau.
If the values of γ ≡ φ3, δB and rB are obtained by directly fitting the data, the extracted value of rB is biased (since it is positive definite by nature). Since the error on γ ≡ φ3 depends on the value of rB some statistical treatment is necessary to correctly estimate the uncertainty. To obviate this effect, both experiments now use a different set of variables in the fits:
| x+ = rB cos( δB+γ ) ≡ rB cos( δB+φ3 ) | y+ = rB sin( δB+γ ) ≡ rB sin( δB+φ3 ) |
| x− = rB cos( δB−γ ) ≡ rB cos( δB−φ3 ) | y− = rB sin( δB−γ ) ≡ rB sin( δB−φ3 ) |
Note that (x+,y+) are determined from B+ decays, while (x−,y−) are determined from B− decays.
These parameters have the advantage of having (approximately) Gaussian distributions, and of having small statistical correlations. Some statistical treatment is necessary to convert these measurements into constraints on the underlying physical parameters γ ≡ φ3, δB and rB [BaBar do not obtain constraints on rB and δB for the B− → DK*− decay due to the reparametrization described above]. Both experiments use frequentist procedures, though there are differences in the details.
The results below have three sets of errors, which are statistical, systematic, and model related uncertainties respectively. For details of correlations in the model uncertainty assigned by Belle, (See Appendix of Ref.) The Belle results also include an additional source of uncertainty due to background from B− → DKSπ− other than B− → DK*−, which we have not included here.
Averages are performed using the following procedure, which is based on a set of reasonable, though imperfect, assumptions.
An update of these averages to include new results from the Winter 2008 conferences (Moriond 2008 (Italy), FPCP2008 (Taiwan) etc.) is in progress. Contact us if you require further information.
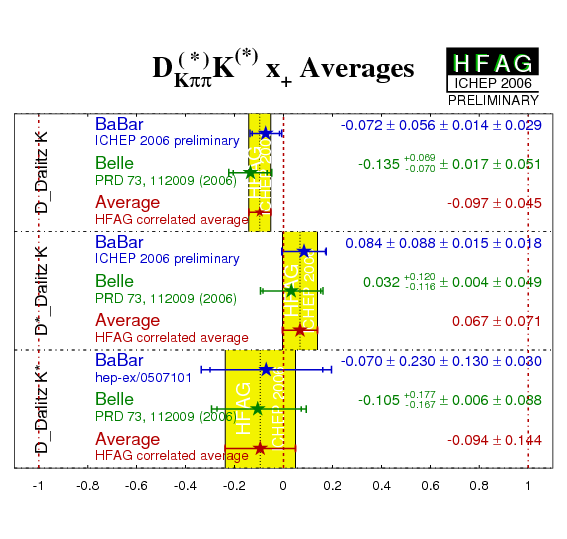
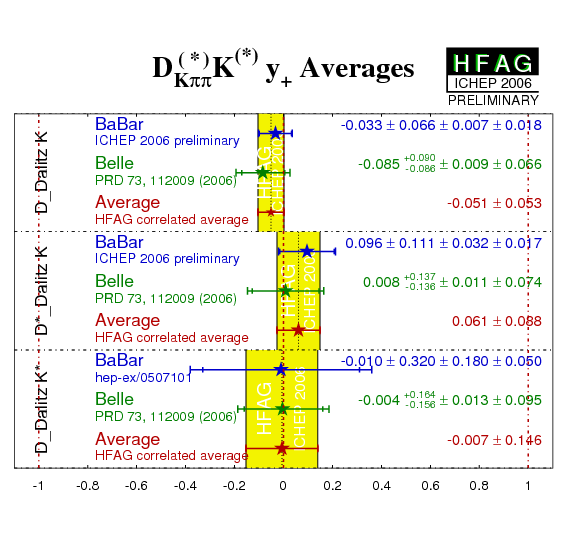
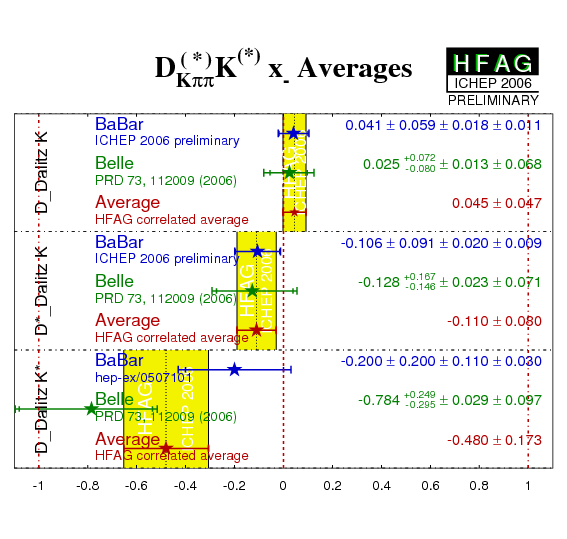
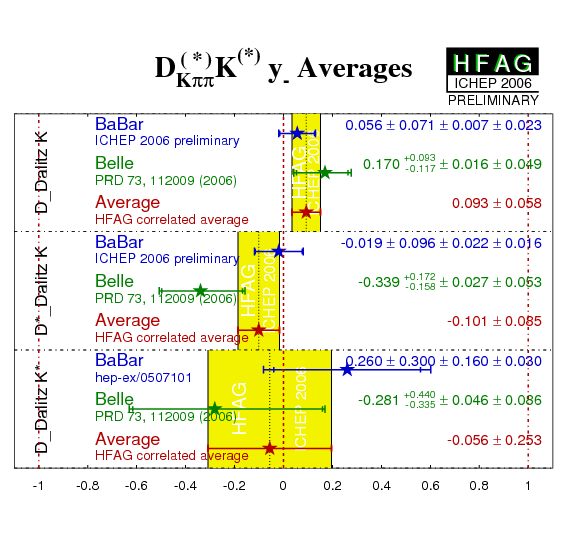
| Mode | Experiment | x+ | y+ | x- | y- | Correlation | Reference |
|---|---|---|---|---|---|---|---|
|
DK−
D→KSπ+π− |
BaBar
N(BB)=347M |
−0.072 ± 0.056 ± 0.014 ± 0.029 | −0.033 ± 0.066 ± 0.007 ± 0.018 | 0.041 ± 0.059 ± 0.018 ± 0.011 | 0.056 ± 0.071 ± 0.007 ± 0.023 | (stat) | hep-ex/0607104 |
|
Belle
N(BB)=386M |
−0.135 +0.069 −0.070 ± 0.017 ± 0.051 | −0.085 +0.090 −0.086 ± 0.009 ± 0.066 | 0.025 +0.072 −0.080 ± 0.013 ± 0.068 | 0.170 +0.093 −0.117 ± 0.016 ± 0.049 | (stat) (model) | PRD 73, 112009 (2006) | |
| Average No model error |
−0.097 ± 0.045 | −0.051 ± 0.053 | 0.045 ± 0.047 | 0.093 ± 0.058 | (stat+syst) |
HFAG correlated average
χ2 = 1.5/4 dof (CL=0.83 ⇒ 0.2σ) |
|
|
NB. The contours in these plots do not include model errors. |
eps.gz png |
eps.gz png |
eps.gz png |
||||
|
D*K−
D*→Dπ0 & D*→Dγ D→KSπ+π− |
BaBar
N(BB)=347M |
0.084 ± 0.088 ± 0.015 ± 0.018 | 0.096 ± 0.111 ± 0.032 ± 0.017 | −0.106 ± 0.091 ± 0.020 ± 0.009 | −0.019 ± 0.096 ± 0.022 ± 0.016 | (stat) | hep-ex/0607104 |
|
Belle
N(BB)=386M |
0.032 +0.120 −0.116 ± 0.004 ± 0.049 | 0.008 +0.137 −0.136 ± 0.011 ± 0.074 | −0.128 +0.167 −0.146 ± 0.023 ± 0.071 | −0.339 +0.172 −0.158 ± 0.027 ± 0.053 | (stat) (model) | PRD 73, 112009 (2006) | |
| Average No model error |
0.067 ± 0.071 | 0.061 ± 0.088 | −0.110 ± 0.080 | −0.101 ± 0.085 | (stat+syst) | HFAG correlated average χ2 = 3.2/4 dof (CL=0.52 ⇒ 0.6σ) |
|
|
NB. The contours in these plots do not include model errors. |
eps.gz png |
eps.gz png |
eps.gz png |
||||
|
DK*−
K*− → KSπ− D→KSπ+π− |
BaBar
N(BB)=227M |
−0.070 ± 0.230 ± 0.130 ± 0.030 | −0.010 ± 0.320 ± 0.180 ± 0.050 | −0.200 ± 0.200 ± 0.110 ± 0.030 | 0.260 ± 0.300 ± 0.160 ± 0.030 | - | hep-ex/0507101 |
|
Belle
N(BB)=386M |
−0.105 +0.177 −0.167 ± 0.006 ± 0.088 | −0.004 +0.164 −0.156 ± 0.013 ± 0.095 | −0.784 +0.249 −0.295 ± 0.029 ± 0.097 | −0.281 +0.440 −0.335 ± 0.046 ± 0.086 | (stat) (model) | PRD 73, 112009 (2006) | |
| Average No model error |
−0.094 ± 0.144 | −0.007 ± 0.146 | −0.480 ± 0.173 | −0.056 ± 0.253 | (stat+syst) | HFAG correlated average χ2 = 4.6/4 dof (CL=0.33 ⇒ 1.0σ) |
|
|
NB. The contours in these plots do not include model errors. |
eps.gz png |
eps.gz png |
eps.gz png |
||||
|
NB. The uncertainities assigned to the averages given in these plots do not include model errors. |
eps.gz png |
eps.gz png |
eps.gz png |
eps.gz png |
Digression:
|
An update of these averages to include new results from the Winter 2008 conferences (Moriond 2008 (Italy), FPCP2008 (Taiwan) etc.) is in progress. Contact us if you require further information. Constraining γ ≡ φ3:The measurements of x+,− and y+,− in the various D(*)K(*) decay modes can be used to place bounds on γ ≡ φ3. Both experiments have done so using frequentist techniques. |
|||
|
BaBar obtain
γ = (92 ± 41 ± 11 ± 12)° (from DK− & D*K−) |
Belle obtain
φ3 = (53 +15−18 ± 3 ± 9)° (from DK−,D*K− & DK*−) |
||
| The experiments also obtain values for the hadronic parameters | |||
| rB (DK−) < 0.140 (1σ) | δ B (DK−) = (118 ± 63 ± 19 ± 36)° | rB (DK−) = 0.16 ± 0.05 ± 0.01 ± 0.05 | δ B (DK−) = (146 +19−20 ± 3 ± 23)° |
| 0.017 < rB (D*K−) < 0.203 | δ B (D*K−) = (298 ± 59 ± 18 ± 10)° | rB (D*K−) = 0.18 +0.11−0.10 ± 0.01 ± 0.05 | δ B (D*K−) = (302 +34−35 ± 6 ± 23)° |
| . | . | rB (DK*−) = 0.56 +0.22−0.16 ± 0.04 ± 0.08 | δ B (DK*−) = (243+20−23 ± 3 ± 50 )° |
|
For attempts to extract γ ≡ φ3
from the combined BaBar and Belle results,
visit the
CKMfitter
and
UTfit sites.
Note that the above results suffer an ambiguity: γ → γ + π ≡ φ3 → φ3 + π, δ → δ + π. We quote the result which is consistent with the Standard Model fit. |
|||
BaBar have performed a similar Dalitz plot analysis using the decay D → π+π−π0. In this case the measured yields of B− → DK− and B+ → DK+ events are found to make a significant contribution to the sensitivity to CP violation and this information is included into the fit. Consequently, an alternative set of fit parameters is used in order to avoid significant biasing and nonlinear correlations. The result is parameterized in terms of polar coordinates:
| ρ± ≡ | z± - x0 | | θ± ≡ tan− 1 (Im(z±) / (Re(z±) - x0)) |
where the constant x0 = 0.850 depends on the amplitude structure of the D → π+π−π0 decay, and z± = rB ei( δB ± γ ) ≡ rB ei( δB ± φ3 ). This choice of variables is motivated by the fact that the yields of B± decays are proportional to 1 + ρ±2 - x02. The uncertainty due to the D decay model is included in the systematic error.
| Mode | Experiment | ρ+ | θ+ | ρ− | θ− | Reference |
|---|---|---|---|---|---|---|
|
DK−
D→ π+π−π0 |
BaBar
N(BB)=324M |
0.75 ± 0.11 ± 0.04 | (147 ± 23 ± 1)° | 0.72 ± 0.11 ± 0.04 | (173 ± 42 ± 2)° | PRL 99 (2007) 251801 |
| Average | 0.75 ± 0.12 | (147 ± 23)° | 0.72 ± 0.12 | (173 ± 42)° |
Digression:
|
Constraining γ ≡ φ3:
The measurements of ρ+,− and θ+,− can be used to place bounds on γ ≡ φ3 and the hadronic parameters. BaBar use a frequentist technique to obtain −30° < γ < 76°, 0.06 < rB (DK−) < 0.78 and −27° < δ B (DK−) < 78° at the 68% confidence level. |
BaBar have performed a similar Dalitz plot analysis to that described above using neutral B decays. In order to avoid complications due to B0–B0-bar oscillations (see here), the decay to the self-tagging final state DK*0, with K*0 → K+π−, is used. Effects due to the natural width of the K*0 are handled using the parametrization suggested by Gronau.
|
Constraining γ ≡ φ3:
BaBar extract the three-dimensional likelihood for the parameters (γ, δS, rS) and, combining with a separately measured PDF for rS (using a Bayesian technique), obtain bounds on each of the three parameters. |
| γ = (162 ± 56)°, δS = (62 ± 57)° rS < 0.55 at 95% probability |
| Note that there is an ambiguity in the solutions for γ and δS (γ, δS → γ+π, δS+π). |