(allowing for CP violation) People working on this: David Asner, Bostjan Golob, Brian Petersen, Alan Schwartz
For a complete list of references click here
For mixing results assuming no CP violation click here
Notation: the mass eigenstates are denoted
D 1 ≡ p|D0> +
q|D0> and
D 2 ≡ p|D0> −
q|D0>;
R D is the ratio of magnitudes of
D0
→ f and D0 → f amplitudes;
and δ (φ) is the strong (weak) phase difference between
D0
→ f and D0 → f amplitudes.
Allowing for CPV, there are a total of 7 underlying parameters:
x, y, δ,
R D, A D, |q/p|, and φ
From all experiments, there are currently 22 observables:
y CP ,
A Γ ,
x
K0S π+ π − ,
y
K0S π+ π − ,
|q/p|
K0S π+ π − ,
Arg(q/p) = φ
K0S π+ π −
(R M ) semileptonic ,
(R M )
K+ π− π 0 ,
(R M )
K+ π− π
+ π − ,
(R M ) Ψ(3770) ,
(R D) BaBar ,
(A D) BaBar ,
(x'±, y'±) BaBar ,
(R D) Belle ,
(A D) Belle ,
(x'±, y'±) Belle ,
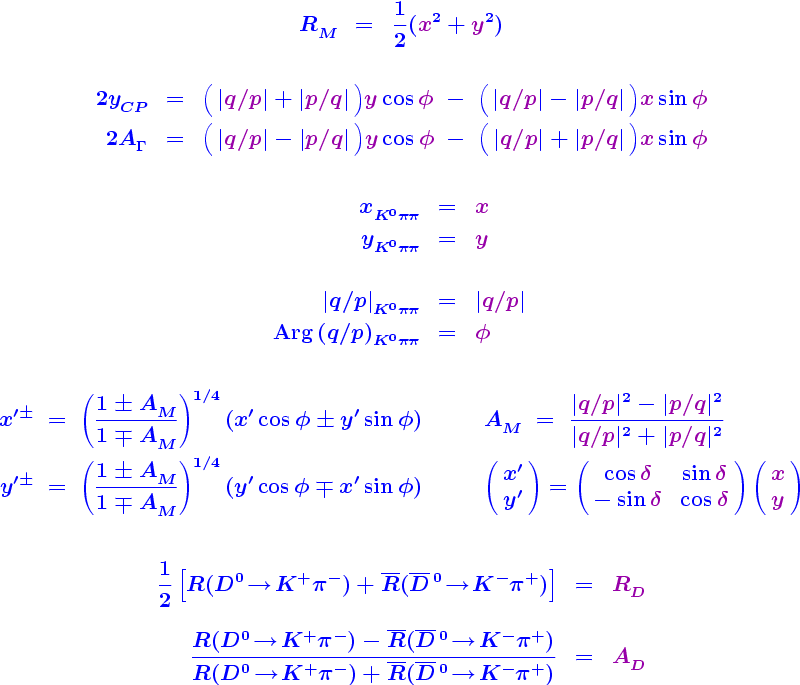
The relationships between these observables and the underlying
parameters are given below; the observables appear on the left sides
of the equations (in blue), and the underlying parameters on the right
sides (in purple).
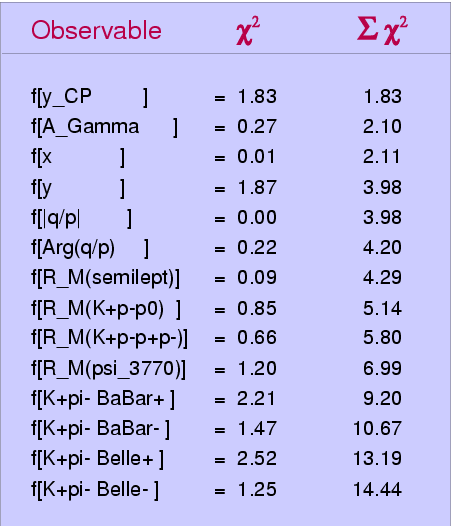
Observables used:
| Index | Observable | Value | Source | |||||||||||||||||||||
|---|---|---|---|---|---|---|---|---|---|---|---|---|---|---|---|---|---|---|---|---|---|---|---|---|
| 1 | y CP | (1.12 ± 0.32)% | World average (COMBOS combination) of D0 → K+ K− / π+ π − results | |||||||||||||||||||||
| 2 | A Γ | (−0.17 ± 0.30)% | World average (COMBOS combination) of D0 → K+ K− / π+ π − results | |||||||||||||||||||||
| 3 | x | (0.811 ± 0.334)% | World average (COMBOS combination) of D0 → K0 S π+ π − results | |||||||||||||||||||||
| 4 | y | (0.309 ± 0.281)% | World average (COMBOS combination) of D0 → K0 S π+ π − results | |||||||||||||||||||||
| 5 | |q/p| | 0.860 ± 0.316 | Belle D0 → K0 S π+ π − results | |||||||||||||||||||||
| 6 | Arg(q/p) | (−0.244 ± 0.333) radians | Belle D0 → K0 S π+ π − results | |||||||||||||||||||||
| 7 | R M | (0.0173 ± 0.0387)% | World average (COMBOS combination) of D0 → K+l− ν results | |||||||||||||||||||||
| 8 | R M | (0.023 ± 0.01844)% | BaBar K+ π − π 0 result | |||||||||||||||||||||
| 9 | R M | (0.019 ± 0.0161)% | BaBar K+ π − π + π − result | |||||||||||||||||||||
| 10 | R M | (0.17 ± 0.15)% | CLEOc Ψ(3770) result | |||||||||||||||||||||
| 11 |
|
|
BaBar
K+ π − results; correlation coefficients:
|
|||||||||||||||||||||
| 12 |
|
| BaBar K+ π − results; correlation coefficients same as above. | |||||||||||||||||||||
| 13 |
|
|
Belle
K+ π − results; correlation coefficients:
|
|||||||||||||||||||||
| 14 |
|
| Belle K+ π − results; correlation coefficients same as above. |
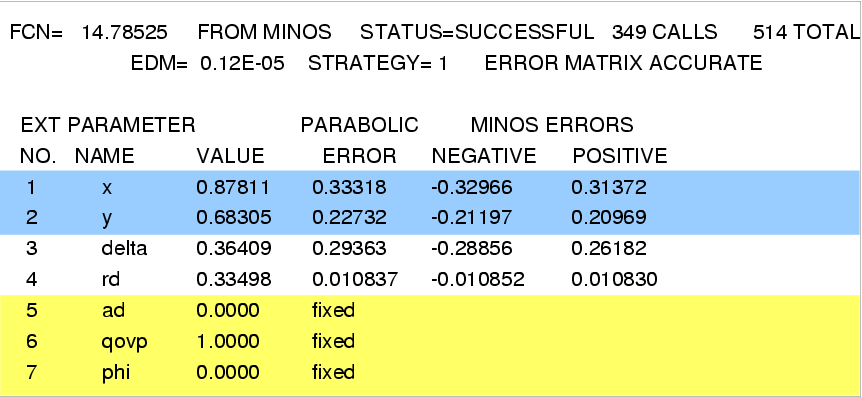
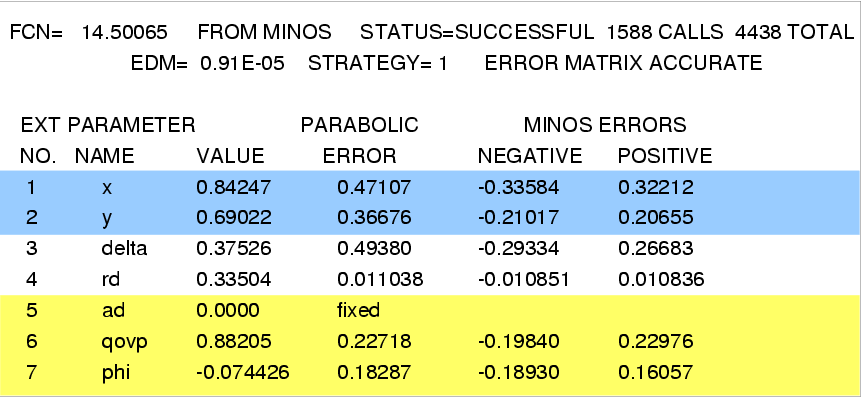
MINUIT fit results: note that x, y, R D, and A D are in percent; δ and φ are in radians.
Fit #1, no CP violation (AD=0, |q/p|=1, φ=0, fixed):
Fit #2, no direct CP violation (AD=0, fixed):
Fit #3, allowing direct CP violation (i.e., all parameters floated):
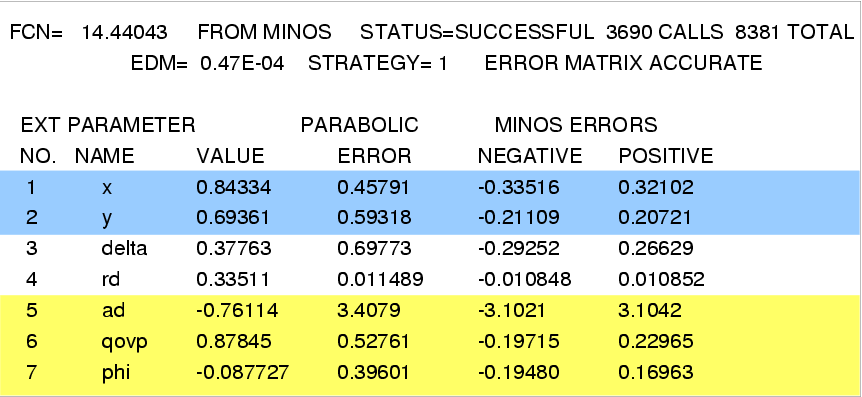
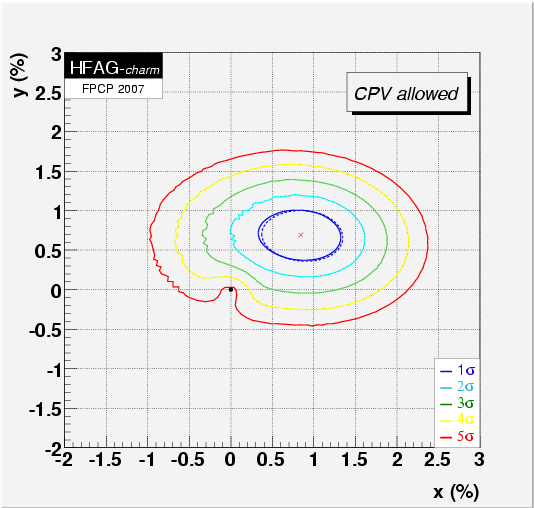
The final results allowing for CPV are:
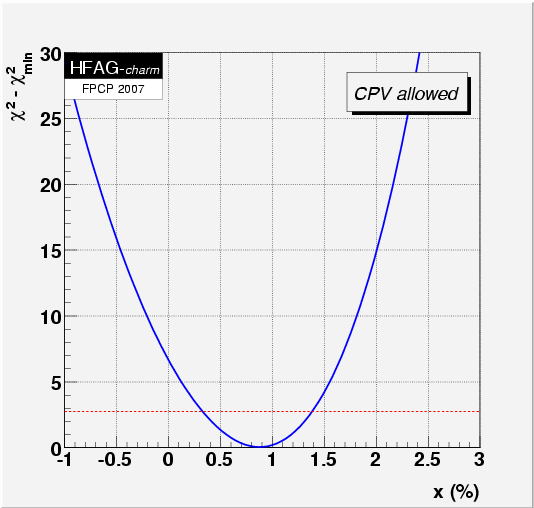
x = (0.84 +0.32 −0.34 )%,
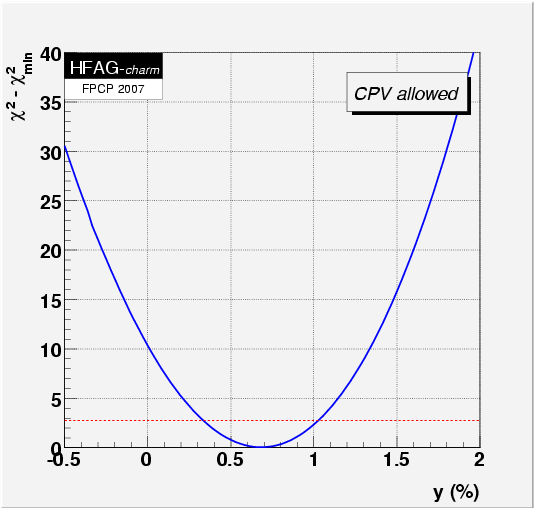
y = (0.69 ± 0.21)%,
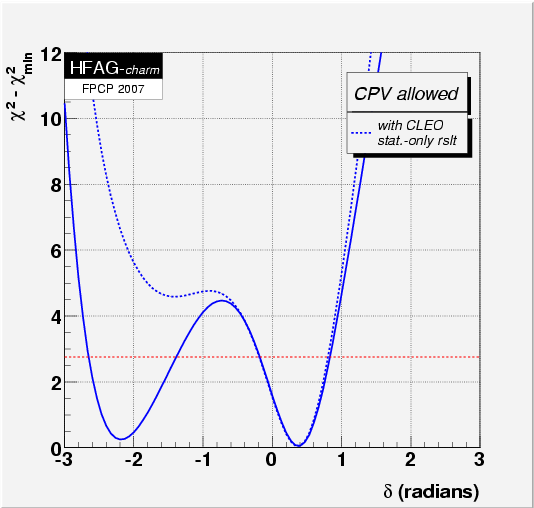
δ = (0.38 +0.27 −0.29 ) radians,
R D = (0.335 ± 0.011)%,
A D = (−0.76 ± 3.10)%,
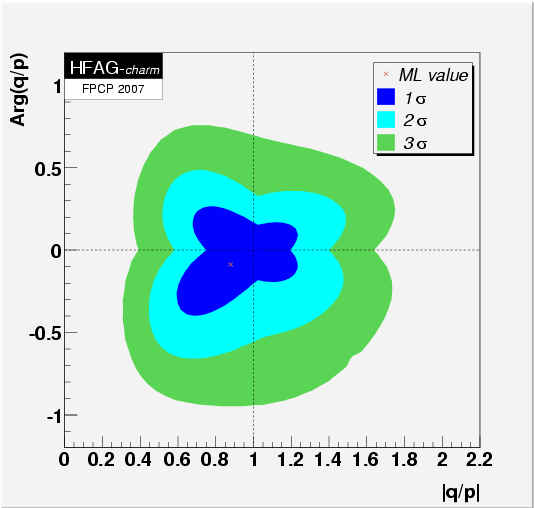
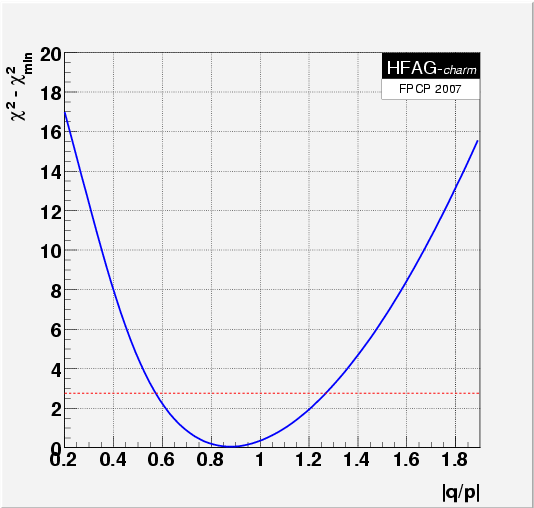
|q/p| = 0.88 +0.23 −0.20 ,
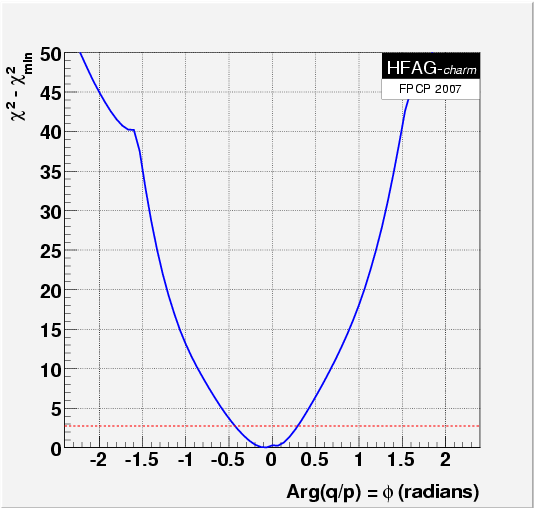
φ = (−0.09 +0.17 −0.19 ) radians.
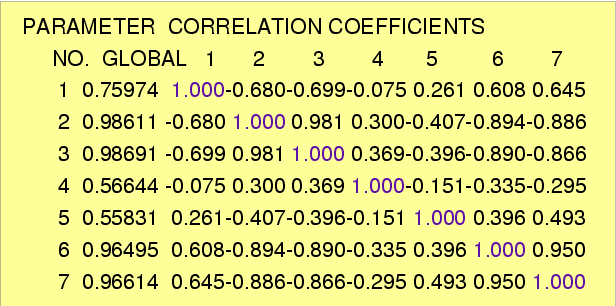
MIGRAD correlation coefficients:
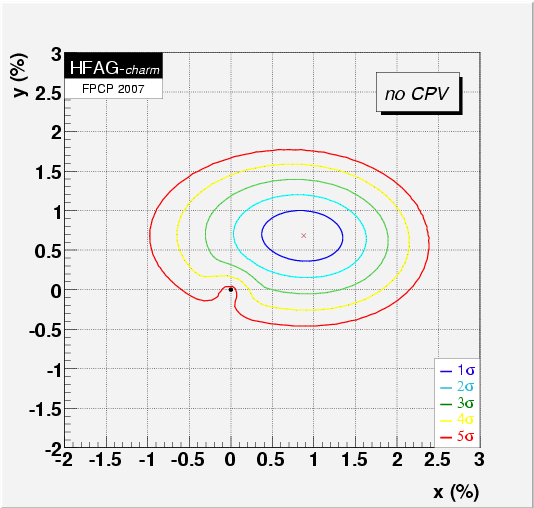
MNCONTOUR 2-d plots: no CPV plot can be compared with method combining log-likelihood functions (here) , which accounts for non-Gaussian likelihoods.
"MNCONTOUR" 1-d plots: red dashed horizontal line denotes Δχ 2 = 2.70, corresponding to 90% C.L. Cusp points in φ plot result from multiple solutions.
Last modified 3 December 2007. Send comments to A. Schwartz or M. Purohit