People working on this:
Marco Gersabeck
Notation:
This combination uses measurements of direct and indirect CP violation
to extract the level of agreement for a no-CP-violation hypothesis.
The observables are:
Year
Experiment
Results
Δ〈t〉/τ
〈t〉/τ
Comment
Reference
2012
BaBar
AΓ = (0.09 ±0.26 (stat.) ±0.06 (syst.))%
-
-
468 fb−1 near Υ(4S) resonance
J.P. Lees et al. (BaBar Collab.), Phys.Rev. D87 (2013) 012004.
2014
CDF
AΓ = (−0.12 ±0.12)%
-
-
9.7 fb−1 √ s = 1.96 TeV p p collisions
T.A. Aaltonen et al. (CDF Collab.), Phys.Rev. D90 (2014) 111103.
2015
LHCb
AΓ = (−0.125 ±0.073)%
-
-
3 fb−1 √ s = 7+8 TeV pp collisions, B→D0μX
R. Aaij et al. (LHCb Collab.), JHEP 04 (2015) 043.
2015
Belle
AΓ = (−0.03 ±0.20 (stat.) ±0.07 (syst.))%
-
-
976 fb−1 near Υ(4S) resonance
M. Staric et al. (Belle Collab.), Phys.Lett. B753 (2016) 412.
2016
LHCb
AΓ(KK) = (−0.030 ±0.032 (stat.) ±0.010 (syst.))%
AΓ(ππ) = (+0.046 ±0.058 (stat.) ±0.012 (syst.))%
-
-
3 fb−1 √ s = 7+8 TeV pp collisions, prompt D*
R. Aaij et al. (LHCb Collab.), Phys.Rev.Lett. 118 (2017) 261803.
2008
BaBar
ACP(KK) = (0.00 ±0.34 (stat.) ±0.13 (syst.))%
ACP(ππ) = (−0.24 ±0.52 (stat.) ±0.22 (syst.))%
0.00
1.00
385.8 fb−1 near Υ(4S) resonance
B. Aubert et al. (BABAR Collab.), Phys. Rev. Lett. 100, 061803 (2008).
2012
CDF
ΔACP = (−0.62 ±0.21 (stat.) ±0.10 (syst.))%
0.25
2.58
9.7 fb−1
√ s =
1.96 TeV p p collisions
T. Aaltonen et al. (CDF Collab.), Phys.Rev.Lett. 109 (2012) 111801.
2014
LHCb
ΔACP = (0.14 ±0.16 (stat.) ±0.08 (syst.))%
0.01
1.07
3 fb−1 √ s = 7+8 TeV pp collisions, B→D0μX
R. Aaij et al. (LHCb Collab.), JHEP 1407 (2014) 041.
2016
LHCb
ΔACP = (−0.10 ±0.08 (stat.) ±0.03 (syst.))%
0.12
2.10
3 fb−1 √ s = 7+8 TeV pp collisions, prompt D*
R. Aaij et al. (LHCb Collab.), Phys.Rev.Lett. 116 (2016) 191601.
2019
LHCb
ΔACP = (-0.09 ±0.08 (stat.) ±0.05 (syst.))%
0.00
1.21
6 fb−1 √ s = 13 TeV pp collisions, B→D0μX
R. Aaij et al. (LHCb Collab.), arXiv:1903.08726.
2019
LHCb
ΔACP = (−0.182 ±0.032 (stat.) ±0.009 (syst.))%
0.13
1.74
6 fb−1 √ s = 13 TeV pp collisions, prompt D*
R. Aaij et al. (LHCb Collab.), arXiv:1903.08726.
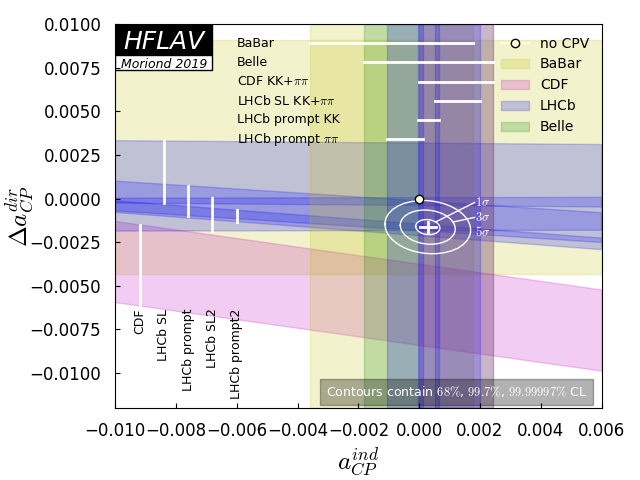
Fit Result
Agreement with no CP violation
CL = 5.4x10⁻⁸
Combination Plot: The combination plot shows the measurements listed in the Table above for ΔACP and AΓ, where the bands represent ±1σ intervals. The point of no CP violation (0,0) is shown as a filled circle, and two-dimensional 68% CL, 99.7% CL, and 99.99997% CL regions are plotted as ellipses with the best fit value as a cross indicating the one-dimensional uncertainties in their center.
From the fit, the change in χ2 from the minimum value for the no-CPV point (0,0) is 33.5; this corresponds to a CL of 5.4x10⁻⁸ for two degrees of freedom or 5.4 standard deviations. The central values and ± 1σ errors for the individual parameters are: