People working on this:
David Asner,
Bostjan Golob,
Milind Purohit,
Alan Schwartz
For a complete list of references click
here
For world average values of measured observables (used below) click
here
Notation:
the mass eigenstates are denoted
D 1 ≡ p|D0> +
q|D0> and
D 2 ≡ p|D0> −
q|D0>;
R D is the ratio of magnitudes of
D0
→ f and D0 → f amplitudes;
δ and δKππ are strong phase differences
between
D0
→ f and D0 → f amplitudes, and
φ is a weak phase difference.
The mixing parameters are defined as
x ≡ (m2 − m1)/Γ and
y ≡ (Γ2 − Γ1)/(2Γ), where
Γ = (Γ1 + Γ2)/2.
In the absence of CP violation, our convention is
x = (mCP+ − mCP−)/Γ,
y = (ΓCP+ − ΓCP−)/(2Γ), and
δ =
δ D0 → K−n(π)
−
δ D0
→ K−n(π) .
Allowing for CP violation,
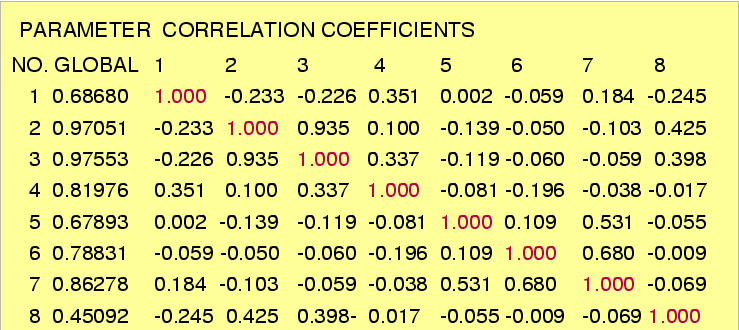
there are a total of 8 underlying parameters:
x, y, δ, δKππ,
R D, A D, |q/p|, and φ
From all experiments, there are currently 28 observables:
y CP ,
A Γ ,
x
K0S π+ π − ,
y
K0S π+ π − ,
|q/p|
K0S π+ π − ,
Arg(q/p) = φ
K0S π+ π −
(R M ) semileptonic ,
(x")
K+ π− π 0 ,
(y")
K+ π− π 0 ,
(R M ) Ψ(3770) ,
(y) Ψ(3770) ,
(R D ) Ψ(3770) ,
(R D 1/2 cos δ) Ψ(3770) ,
(R D) BaBar ,
(A D) BaBar ,
(x'±, y'±) BaBar ,
(R D) Belle ,
(A D) Belle ,
(x'±, y'±) Belle ,
(R D, x', y') CDF .
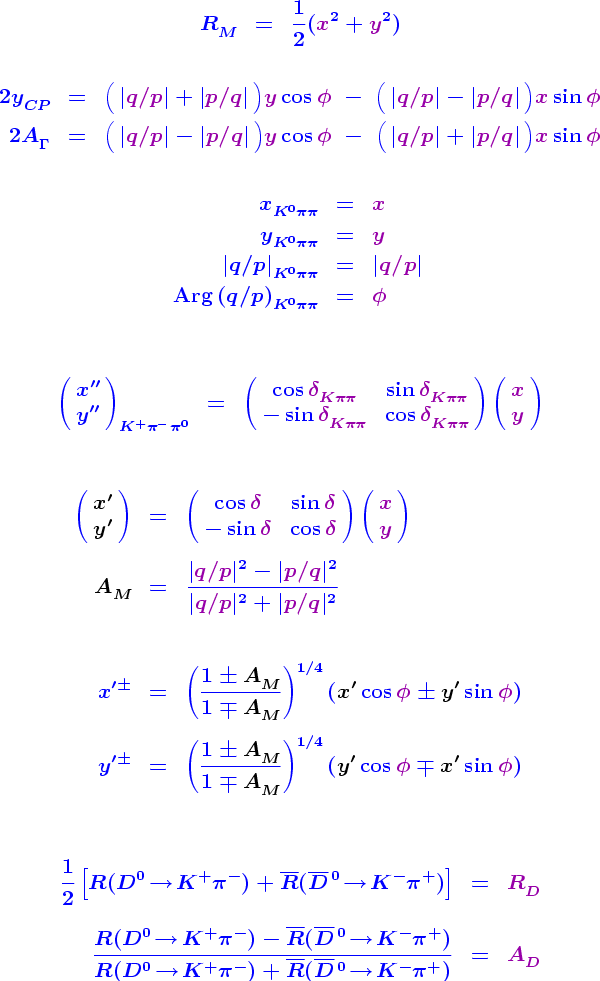
The relationships between these observables and the underlying
parameters are given below; the observables appear in
blue
(on the left sides of the equations), the underlying parameters in
magenta
(on the right sides), and intermediate variables in black.
Observables used:
| Index | Observable | Value | Source | ||||||||||||||||||||||||||||||||||||||||||||||||||
|---|---|---|---|---|---|---|---|---|---|---|---|---|---|---|---|---|---|---|---|---|---|---|---|---|---|---|---|---|---|---|---|---|---|---|---|---|---|---|---|---|---|---|---|---|---|---|---|---|---|---|---|---|---|
| 1 | y CP | (1.072 ± 0.257)% | World average (COMBOS combination) of D0 → K+ K− / π+ π − / K+ K− K0 | ||||||||||||||||||||||||||||||||||||||||||||||||||
| 2 | A Γ | (0.123 ± 0.248)% | World average (COMBOS combination) of D0 → K+ K− / π+ π − results | ||||||||||||||||||||||||||||||||||||||||||||||||||
|
|
|
No CPV:
World average (COMBOS combination)
of
D0 → K0 π+π −
results CPV-allowed: Belle D0 → K0 S π+ π − results; correlation coefficients:
|
||||||||||||||||||||||||||||||||||||||||||||||||||
| 7 | R M | (0.0130 ± 0.0269)% | World average (COMBOS combination) of D0 → K+l− ν results | ||||||||||||||||||||||||||||||||||||||||||||||||||
| 8 |
|
|
|
||||||||||||||||||||||||||||||||||||||||||||||||||
| 9 |
|
|
CLEOc Ψ(3770) results; correlation coefficients:
|
||||||||||||||||||||||||||||||||||||||||||||||||||
| 10 |
|
|
BaBar
K+ π − results; correlation coefficients:
|
||||||||||||||||||||||||||||||||||||||||||||||||||
| 11 |
|
| BaBar K+ π − results; correlation coefficients same as above. | ||||||||||||||||||||||||||||||||||||||||||||||||||
| 12 |
|
|
Belle
K+ π − results; correlation coefficients:
|
||||||||||||||||||||||||||||||||||||||||||||||||||
| 13 |
|
| Belle K+ π − results; correlation coefficients same as above. | ||||||||||||||||||||||||||||||||||||||||||||||||||
| 14 |
|
|
CDF
K+ π − results; correlation coefficients:
|
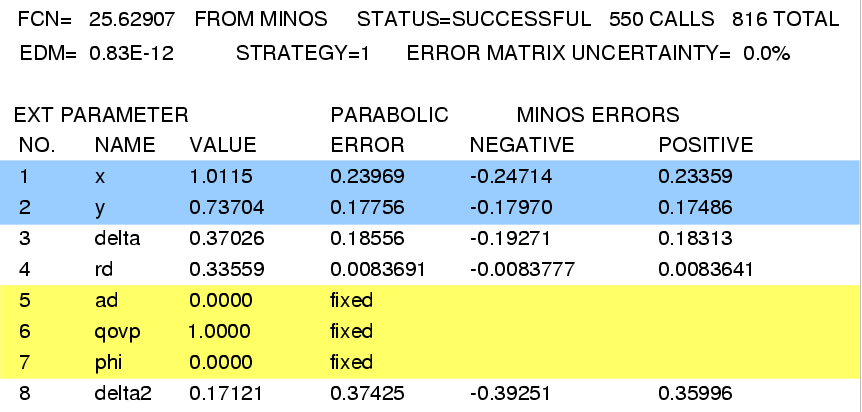
MINUIT fit results: note that x, y, R D, and A D are in percent; δ, δ2 (=δKππ), and φ are in radians.
Fit #1, no CP violation (AD=0, |q/p|=1, φ=0, fixed):
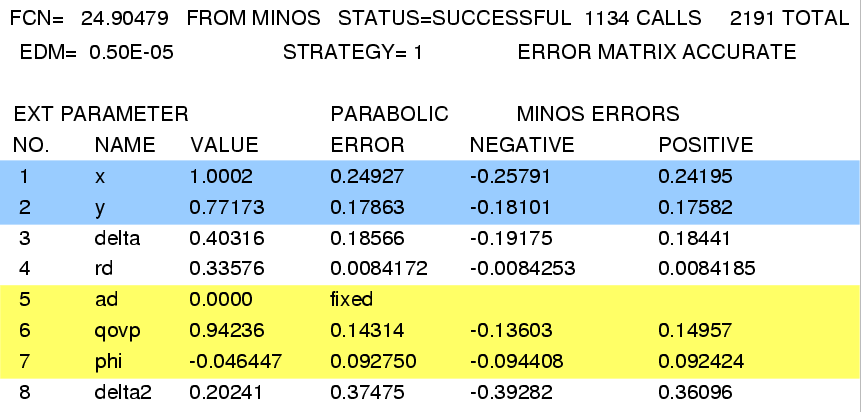
Fit #2, no direct CP violation (AD=0, fixed):
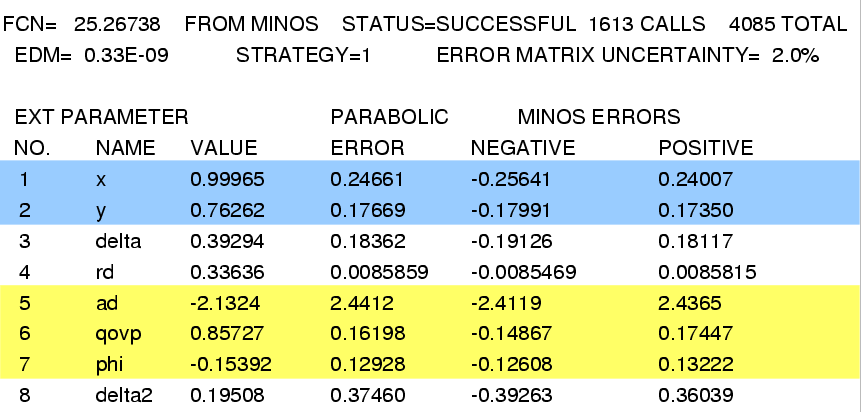
Fit #3, allowing direct CP violation (i.e., all parameters floated):
The final results allowing for CPV are:
| Parameter | Central value (with 1σ error) | 95% C.L. Interval |
|---|---|---|
| x | (1.00 +0.24 −0.26 )% | [0.48, 1.46]% |
| y | (0.76 +0.17 −0.18 )% | [0.40, 1.10]% |
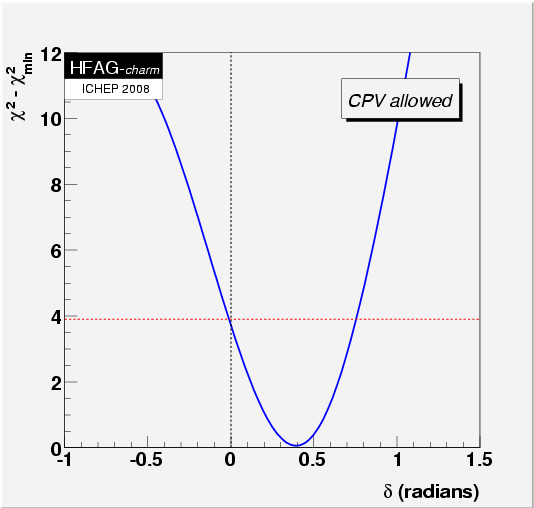
| δ | (22.5 +10.4 −11.0 )° | [−0.6, 43.2]° |
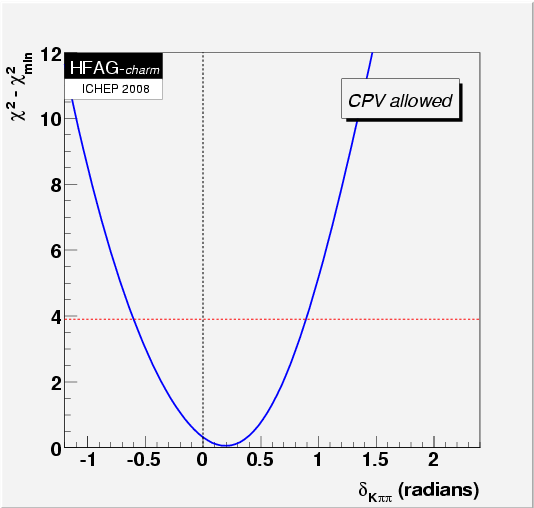
| δKππ | (11.2 +20.6 −22.5 )° | [−34.5, 51.1]° |
| RD | (0.336 ± 0.009)% | [0.320, 0.353]% |
| AD | (−2.1 ± 2.4)% | [−6.8, 2.7]% |
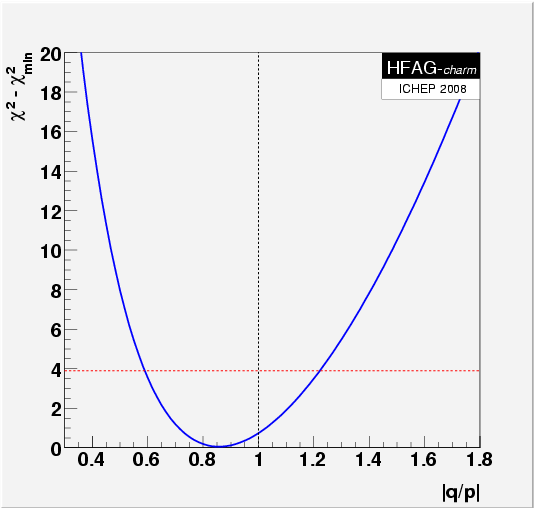
| |q/p| | 0.86 +0.17 −0.15 | [0.59, 1.22] |
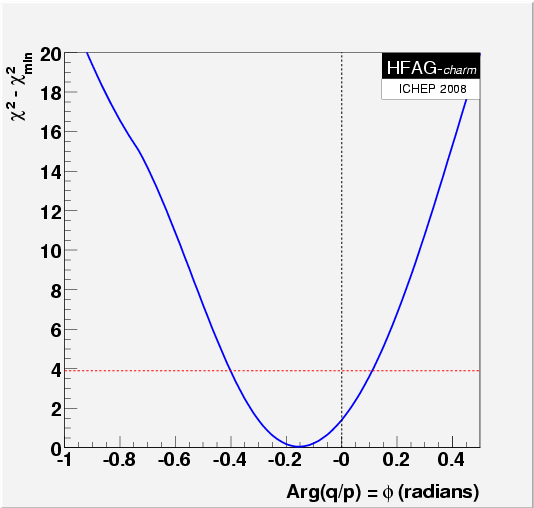
| φ | (−8.8 +7.6 −7.2 )° | [−23.0, 6.3]° |
MIGRAD correlation coefficients:
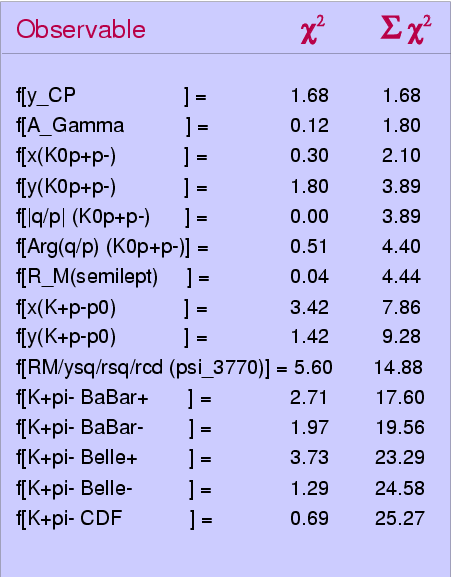
χ 2 contributions:
MNCONTOUR-like 2-d plots:
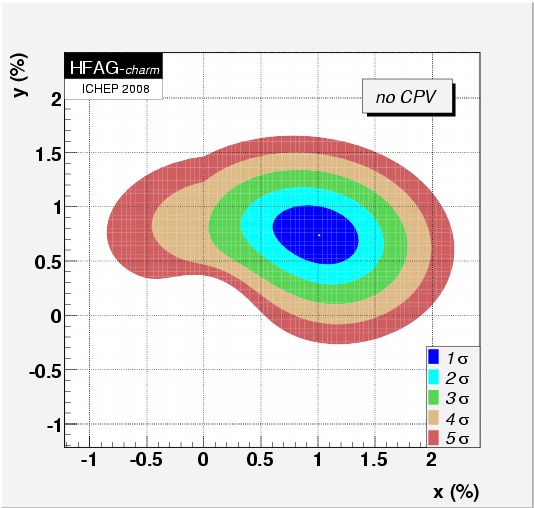
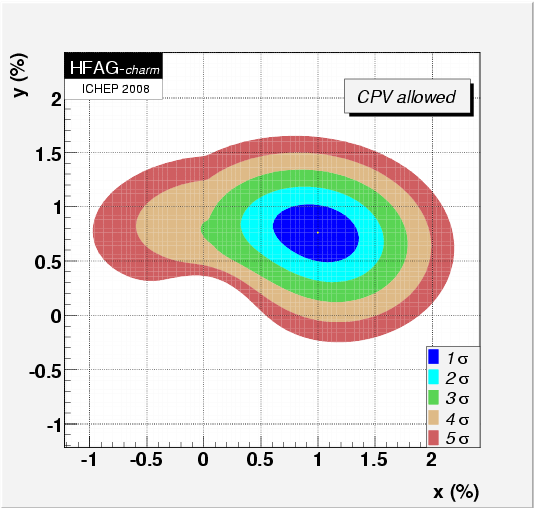
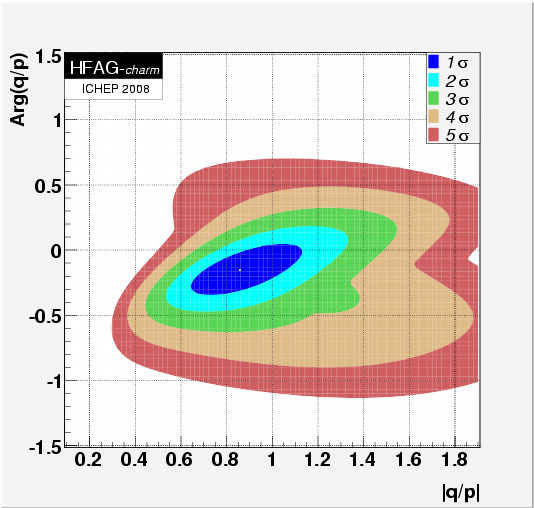
CPV-allowed plot, no mixing (x,y) = (0,0) point:
Δ χ 2 = 102.6,
CL = 5.3 x 10 −23 ,
no mixing excluded at 9.8σ
No CPV (|q/p|, φ) = (1,0) point:
Δ χ 2 = 1.33,
CL = 0.486 ,
consistent with CP conservation
MNCONTOUR-like 1-d plots: red dashed horizontal line denotes Δχ 2 = 3.84, corresponding to 95% C.L. Cusp points result from multiple solutions.
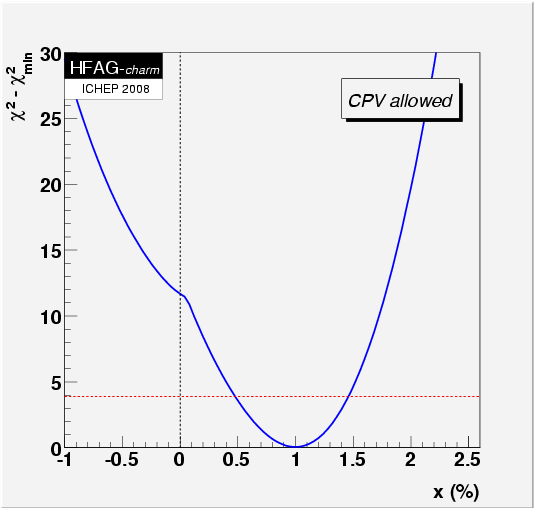
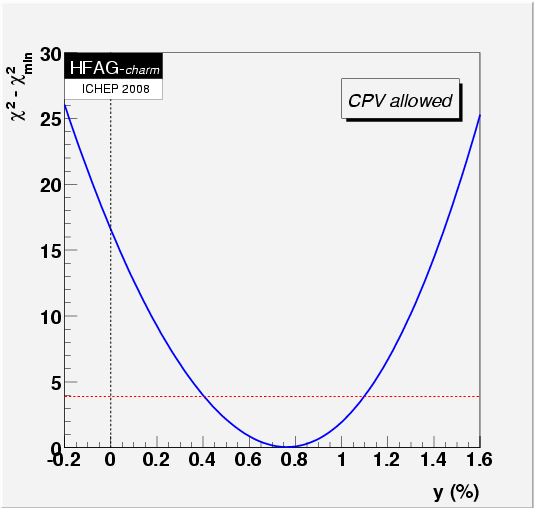
x = 0 point: Δ χ 2 = 11.6, x ≤ 0 excluded at 3.4σ y = 0 point: Δ χ 2 = 16.5, y ≤ 0 excluded at 4.1σ