People working on this:
Marco Gersabeck
Notation:
This combination uses measurements of direct and indirect CP violation
to extract the level of agreement for a no-CP-violation hypothesis.
The observables are:
Year
Experiment
Results
Δ〈t〉/τ
〈t〉/τ
Comment
Reference
2012
BaBar
AΓ = (0.09 ±0.26 (stat.) ±0.06 (syst.))%
-
-
468 fb−1 near Υ(4S) resonance
J.P. Lees et al. (BaBar Collab.), Phys.Rev. D87 (2013) 012004.
2014
CDF
AΓ = (−0.12 ±0.12)%
-
-
9.7 fb−1 √ s = 1.96 TeV p p collisions
T.A. Aaltonen et al. (CDF Collab.), Phys.Rev. D90 (2014) 111103.
2015
Belle
AΓ = (−0.03 ±0.20 (stat.) ±0.07 (syst.))%
-
-
976 fb−1 near Υ(4S) resonance
M. Staric et al. (Belle Collab.), Phys.Lett. B753 (2016) 412.
2021
LHCb
ΔY(KK) = (−0.003 ±0.013 (stat.) ±0.003 (syst.))%
ΔY(ππ) = (-0.036 ±0.024 (stat.) ±0.004 (syst.))%
-
-
9 fb−1 √ s = 7+8+13 TeV pp collisions, prompt D* and B→D0μX
R. Aaij et al. (LHCb Collab.), Phys.Rev.Lett. 118 (2017) 261803.
2008
BaBar
ACP(KK) = (0.00 ±0.34 (stat.) ±0.13 (syst.))%
ACP(ππ) = (−0.24 ±0.52 (stat.) ±0.22 (syst.))%
0.00
1.00
385.8 fb−1 near Υ(4S) resonance
B. Aubert et al. (BABAR Collab.), Phys. Rev. Lett. 100, 061803 (2008).
2012
CDF
ΔACP = (−0.62 ±0.21 (stat.) ±0.10 (syst.))%
0.25
2.58
9.7 fb−1
√ s =
1.96 TeV p p collisions
T. Aaltonen et al. (CDF Collab.), Phys.Rev.Lett. 109 (2012) 111801.
2014
LHCb
ΔACP = (0.14 ±0.16 (stat.) ±0.08 (syst.))%
0.01
1.07
3 fb−1 √ s = 7+8 TeV pp collisions, B→D0μX
R. Aaij et al. (LHCb Collab.), JHEP 1407 (2014) 041.
2016
LHCb
ΔACP = (−0.10 ±0.08 (stat.) ±0.03 (syst.))%
0.12
2.10
3 fb−1 √ s = 7+8 TeV pp collisions, prompt D*
R. Aaij et al. (LHCb Collab.), Phys.Rev.Lett. 116 (2016) 191601.
2019
LHCb
ΔACP = (-0.09 ±0.08 (stat.) ±0.05 (syst.))%
0.00
1.21
6 fb−1 √ s = 13 TeV pp collisions, B→D0μX
R. Aaij et al. (LHCb Collab.), arXiv:1903.08726.
2019
LHCb
ΔACP = (−0.182 ±0.032 (stat.) ±0.009 (syst.))%
0.13
1.74
6 fb−1 √ s = 13 TeV pp collisions, prompt D*
R. Aaij et al. (LHCb Collab.), arXiv:1903.08726.
Fit Result
Agreement with no CP violation
CL = 6.9x10⁻⁸
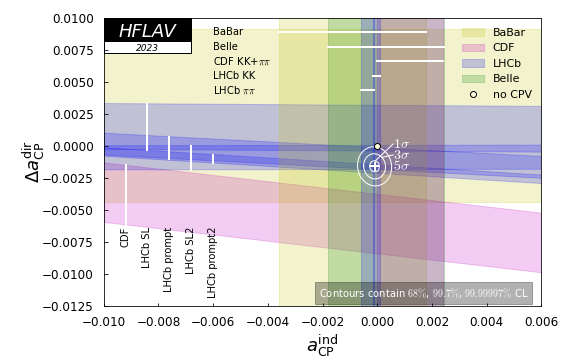
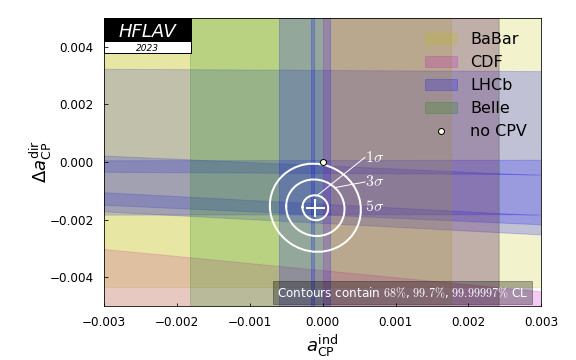
Combination Plot: The combination plot shows the measurements listed in the Table above for ΔACP and AΓ, where the bands represent ±1σ intervals. The point of no CP violation (0,0) is shown as a filled circle, and two-dimensional 68% CL, 99.7% CL, and 99.99997% CL regions are plotted as ellipses with the best fit value as a cross indicating the one-dimensional uncertainties in their center. The second plot provides a zoomed-in view of the fit region.
From the fit, the change in χ2 from the minimum value for the no-CPV point (0,0) is 32.3; this corresponds to a CL of 9.7x10⁻⁸ for two degrees of freedom or 5.3 standard deviations. The central values and ± 1σ errors for the individual parameters are:
With the current level of measurements, an average solely of measurements from KK final states becomes feasible. This fit avoids the assumption of universal indirect CP violation. As not all measurements were published with a separate result for the KK final state, only the results in the table below are used. Compared to the fits above, the term proportional to aCPdir yCP is no longer neglected, resulting in the time-dependent measurements being represented by sloped bands, although the smallness of yCP suppresses this effect so they still appear as vertical bands in the figure below. The value for yCP is also extracted from the KK final state alone, for which the only available measurement is that of the LHCb collaboration [PRD105(2022)092013], yCP(KK)−yCP(Kπ) = (0.708 ±0.033)%, corrected for yCP(Kπ) as described above to yield yCP(KK) = (0.666 ±0.033)%. The time integrated asymmetry enters the fit according to the equation
| Year | Experiment | Results | 〈t〉/τ | Comment | Reference | |||
|---|---|---|---|---|---|---|---|---|
| 2014 | CDF | AΓ(KK) = (−0.19 ±0.15 (stat.) ±0.04 (syst.))% | - | 9.7 fb−1 √ s = 1.96 TeV p p collisions | T.A. Aaltonen et al. (CDF Collab.), Phys.Rev. D90 (2014) 111103. | |||
| 2021 | LHCb | ΔY(KK) = (−0.003 ±0.013 (stat.) ±0.003 (syst.))% | - | 9 fb−1 √ s = 7+8+13 TeV pp collisions, prompt D* and B→D0μX | R. Aaij et al. (LHCb Collab.), Phys.Rev.Lett. 118 (2017) 261803. | |||
| 2008 | BaBar | ACP(KK) = (0.00 ±0.34 (stat.) ±0.13 (syst.))% | 1.00 | 385.8 fb−1 near Υ(4S) resonance | B. Aubert et al. (BABAR Collab.), Phys. Rev. Lett. 100, 061803 (2008). | |||
| 2008 | Belle | ACP(KK) = (-0.43 ±0.30 (stat.) ±0.11 (syst.))% | 1.00 | 540 fb−1 near Υ(4S) resonance | M. Staric et al. (Belle Collab.), Phys. Lett. B670 (2008) 190. | |||
| 2023 | LHCb | ACP(KK) = (+0.068 ±0.054 (stat.) ±0.016 (syst.))% | 1.75 | 5.7 fb−1 √ s = 13 TeV pp collisions, prompt D* | R. Aaij et al. (LHCb Collab.), Phys. Rev. Lett. 131 (2023) 091802. | |||
| Fit Result |
|
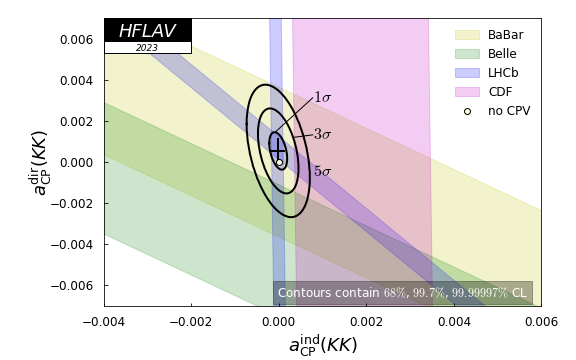
From the fit, the change in χ2 from the minimum value for the no-CPV point (0,0) is 1.44; this corresponds to a CL of 0.49 for two degrees of freedom or 0.7 standard deviations. The central values and ± 1σ errors for the individual parameters are: