People working on this:
Marco Gersabeck
Notation:
This combination uses measurements of direct and indirect CP violation
to extract the level of agreement for a no-CP-violation hypothesis.
The observables are:
Year
Experiment
Results
Δ〈t〉/τ
Comment
Reference
2007
Belle
AΓ = (0.01 ±0.30 (stat.) ±0.15 (syst.))%
-
540 fb−1 near Υ(4S) resonance
M. Staric et al. (Belle Collab.), Phys. Rev. Lett. 98, 211803 (2007).
2008
BaBar
AΓ = (0.26 ±0.36 (stat.) ±0.08 (syst.))%
-
384 fb−1 near Υ(4S) resonance
B. Aubert et al. (BaBar Collab.), Phys. Rev. D 78, 011105(R) (2008).
2011
LHCb
AΓ = (−0.59 ±0.59 (stat.) ±0.21 (syst.))%
-
28 pb−1 √ s = 7 TeV pp collisions
R. Aaij et al. (LHCb Collab.), arXiv:1112.4698 (submitted to JHEP).
2008
BaBar
ACP(KK) = (0.00 ±0.34 (stat.) ±0.13 (syst.))%
ACP(ππ) = (−0.24 ±0.52 (stat.) ±0.22 (syst.))%
0.00
385.8 fb−1 near Υ(4S) resonance
B. Aubert et al. (BABAR Collab.), Phys. Rev. Lett. 100, 061803 (2008).
2008
Belle
ΔACP = (−0.86 ±0.60 (stat.) ±0.07 (syst.))%
0.00
540 fb−1 near Υ(4S) resonance
M. Staric et al. (BELLE Collab.), Phys. Lett. B 670, 190 2008).
2011
CDF
ΔACP = (−0.46 ±0.31 (stat.) ±0.12 (syst.))%
0.26
5.9 fb−1
√ s =
1.96 TeV p p collisions
T. Aaltonen et al. (CDF Collab.), arXiv:1111.5023 (submitted to PRD).
2011
LHCb
ΔACP = (−0.82 ±0.21 (stat.) ±0.11 (syst.))%
0.10
0.62 fb−1 √ s = 7 TeV pp collisions
R. Aaij et al. (LHCb Collab.), arXiv:1112.0938 (submitted to PRL).
Fit Result
Agreement with no CP violation
CL = 0.00128
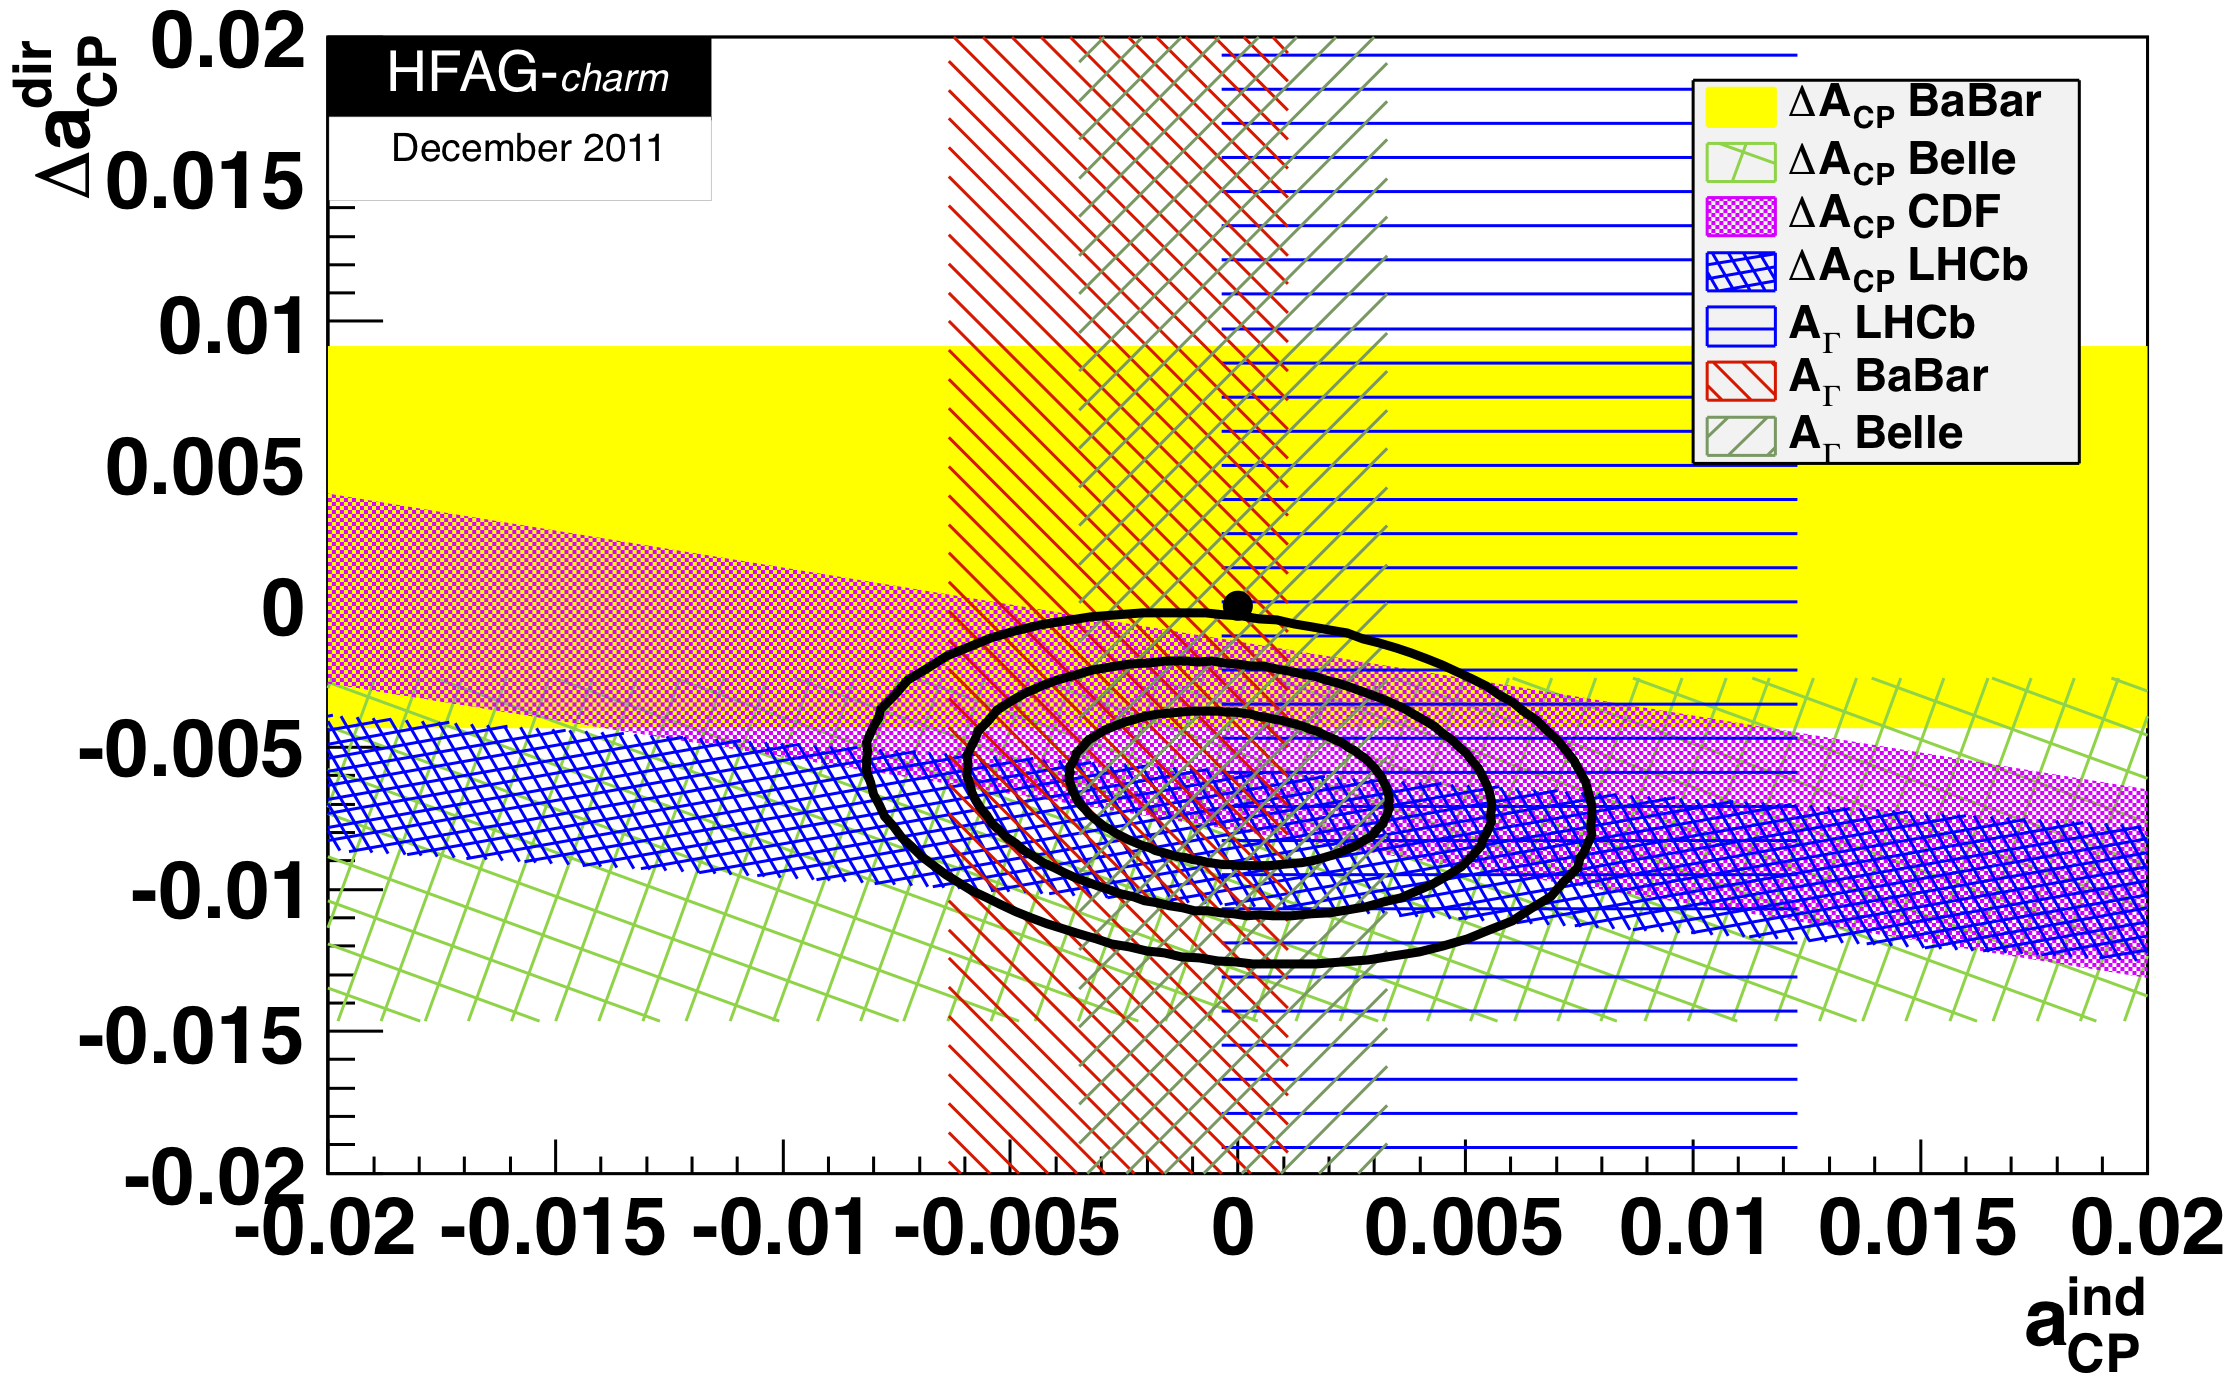
Combination Plot: The combination plot shows the measurements listed in the Table above for ΔACP and AΓ, where the bands represent ±1σ intervals. The point of no CP violation (0,0) is shown as a filled circle, and two-dimensional 68% CL, 95% CL, and 99.7% CL regions are plotted as ellipses.
From the fit, the change in χ2 from the minimum value for the no-CPV point (0,0) is 13.33; this corresponds to a CL of 0.00128 for two degrees of freedom. Thus the data is consistent with no CP violation at 0.128% CL. The central values and ± 1σ errors for the individual parameters are:
Comparison Plots: The comparison plots show the measurements listed in the Table above for ΔACP and AΓ, excluding the LHCb result for ΔACP, where the bands represent ±1σ intervals. The point of no CP violation (0,0) is shown as a filled circle, and two-dimensional 68% CL, 95% CL, and 99.7% CL regions are plotted as ellipses. The right-hand plot has the LHCb result for ΔACP superimposed without it being included in the fit.
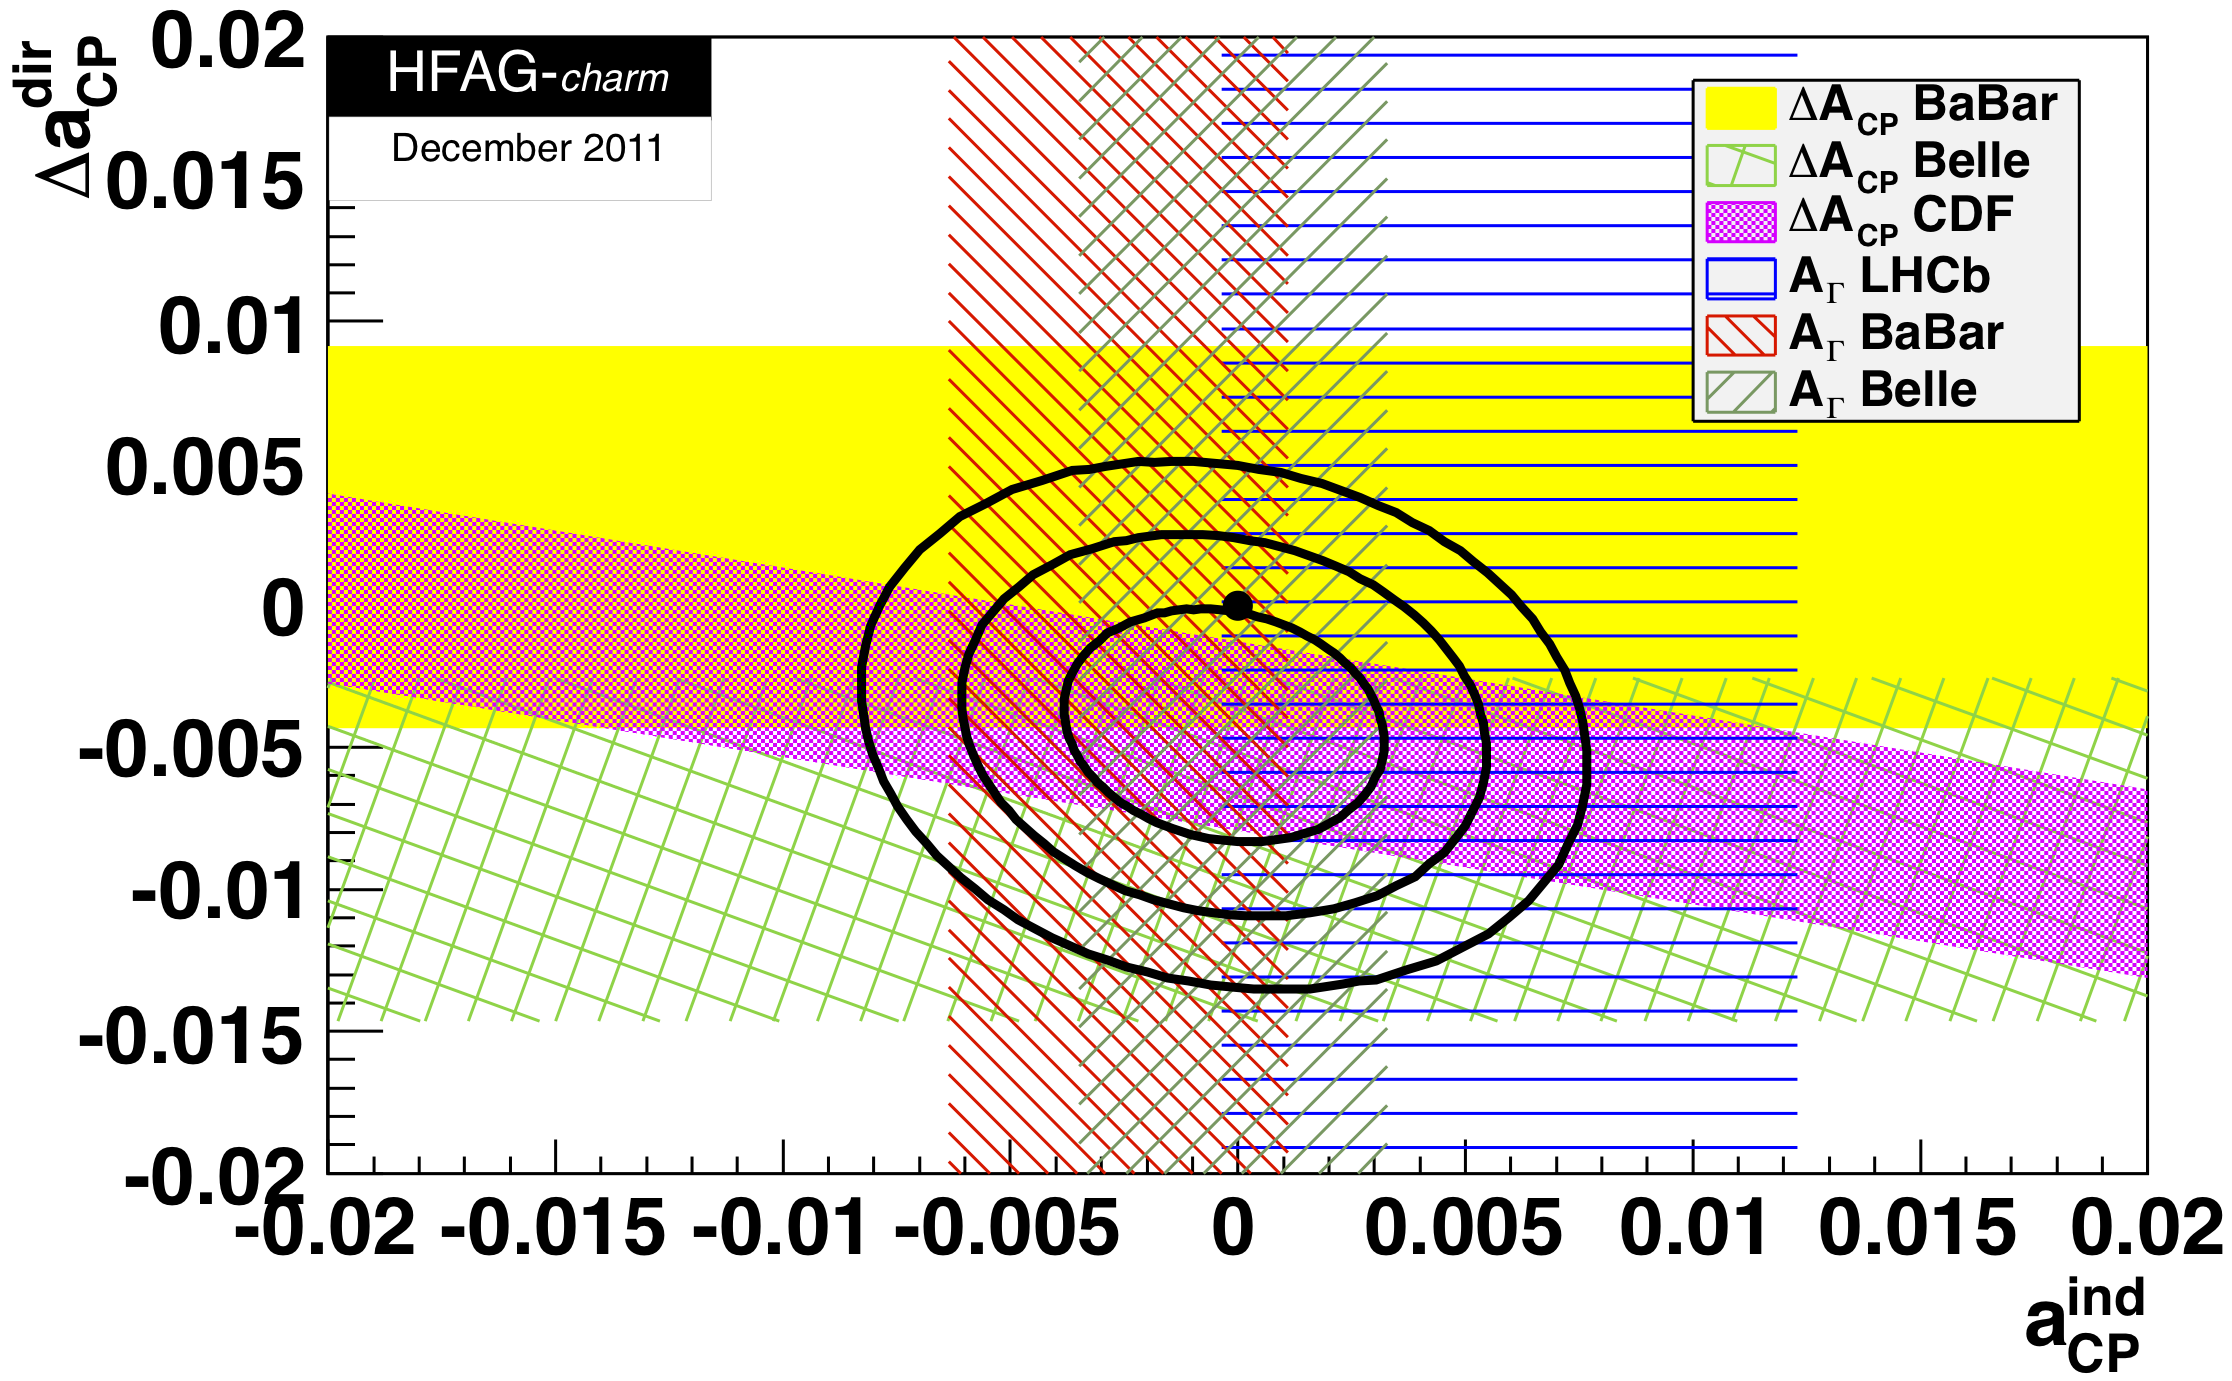
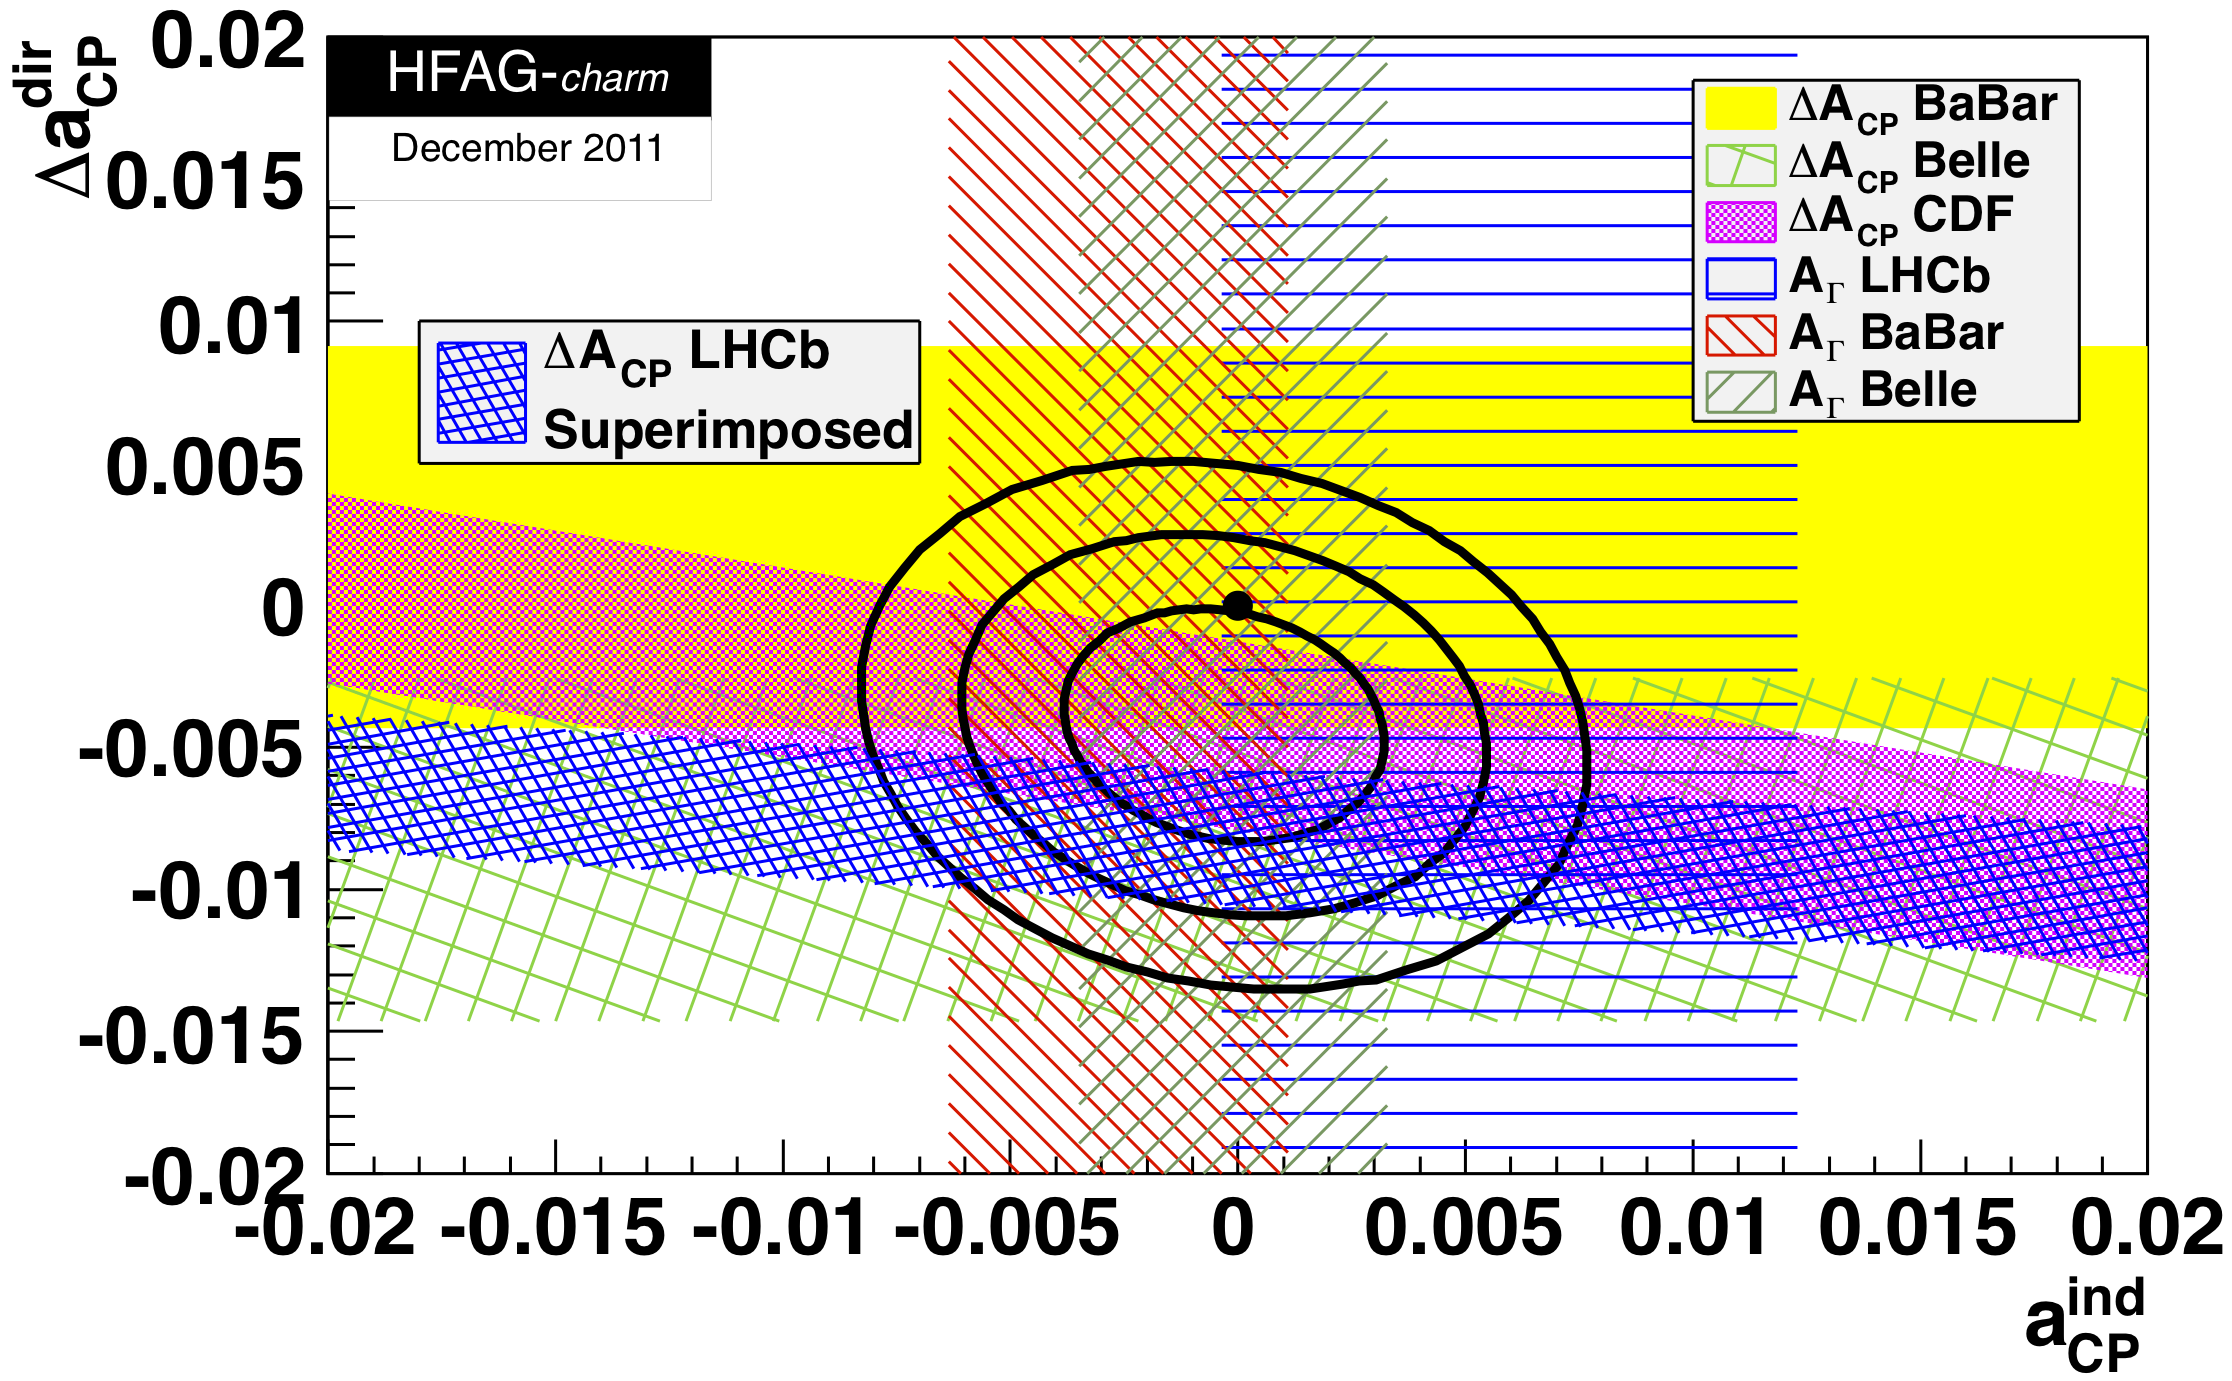
From the fit, the change in χ2 from the minimum value for the no-CPV point (0,0) is 2.578; this corresponds to a CL of 0.2755 for two degrees of freedom. Thus the data is consistent with no CP violation at 27.6% CL. The central values and ± 1σ errors for the individual parameters are: